
XRP price could be poised to recover in the near term after forming a bullish engulfing pattern as key catalysts such as Binance reserves decline and ETF inflows line up.
Summary
- XRP price has formed several bullish chart patterns on the daily chart.
- The supply of XRP tokens on exchanges has fallen to the lowest level in months.
- XRP spot ETF inflows have continued to rise this week.
The Ripple token (XRP) was trading at $1.8885 at press time, slightly above the intraday low of $1.7758.
A possible catalyst for the price of XRP is third-party data showing that the supply of the token on exchanges has continued to fall.
Data compiled by CryptoQuant indicates that supply has been on a steep downward trend since peaking in October of this year. It has now reached its lowest level of the year.
🚨𝐁𝐑𝐄𝐀𝐊𝐈𝐍𝐆: 𝐗𝐑𝐏 𝐈𝐬 𝐕𝐚𝐧𝐢𝐬𝐡𝐢𝐧𝐠 𝐅𝐫𝐨𝐦 𝐁𝐢𝐧𝐚𝐧𝐜𝐞 — 𝐑𝐞𝐬𝐞𝐫𝐯𝐞𝐬 𝐉𝐮𝐬𝐭 𝐇𝐢𝐭 𝐀 𝐌𝐮𝐥𝐭𝐢-𝐌𝐨𝐧𝐭𝐡 𝐋𝐨𝐰 😳📉
Okay this is not a normal chart.
𝐁𝐢𝐧𝐚𝐧𝐜𝐞’𝐬 𝐗𝐑𝐏 𝐫𝐞𝐬𝐞𝐫𝐯𝐞𝐬 just dropped to a multi-month low — meaning XRP is… pic.twitter.com/Kk0vQP3B3p
— Diana (@InvestWithD) December 18, 2025
The drop in Binance exchange reserves is significant because it is the largest venue for XRP trading. Data compiled by CMC shows that XRP volume on Binance on Friday totaled more than $600 million, far more than Upbit’s $355 million.
The drop in exchange balances indicates that investors are moving their tokens into cold storage, suggesting that they expect the tokens to recover over time.
The drop in exchange balances comes at a time when demand for XRP ETFs remains substantial. Data collected by SoSoValue indicate that XRP spot ETFs had over $68 million in inflows this week, bringing cumulative net inflows to $1.06 billion. These inflows brought total assets to $1.14 billion.
XRP ETF Inflows This week they were notable and occurred when Bitcoin and Ethereum funds dumped assets. Ethereum and Bitcoin ETFs have lost more than $568 million and $338 million, respectively.
XRP Price Technical Analysis
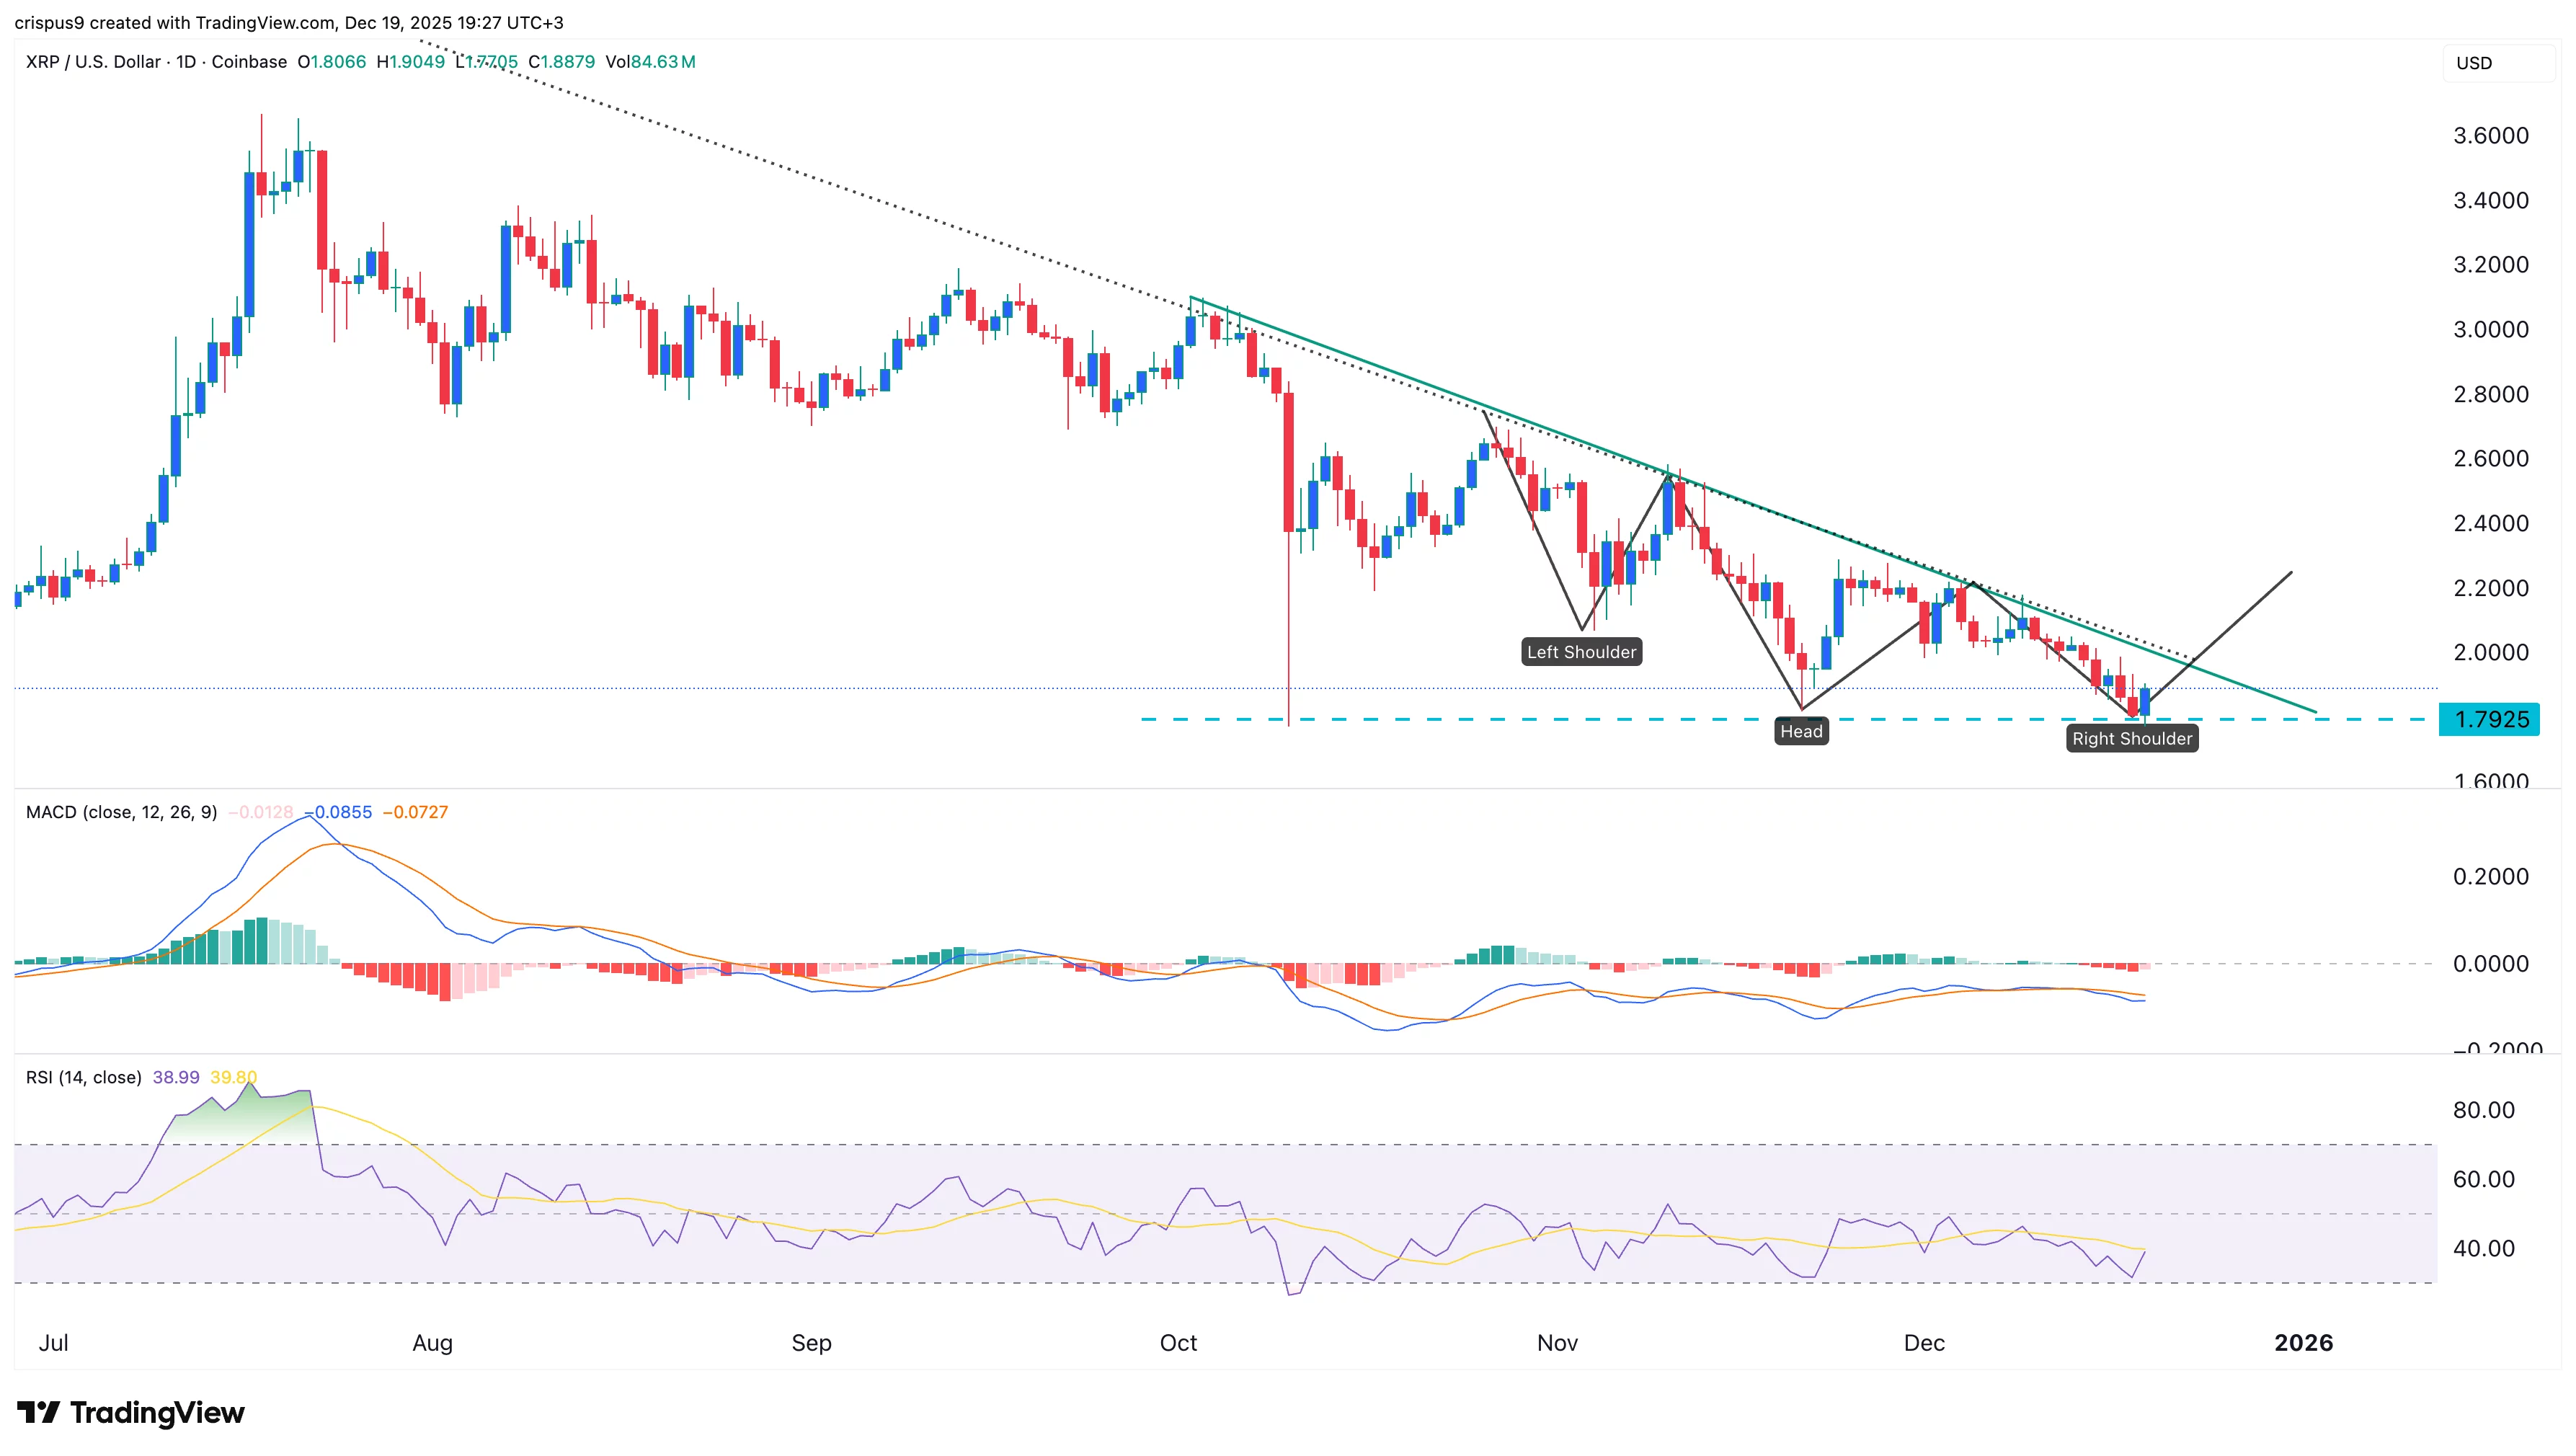
The daily time chart shows that XRP price settled at a crucial support level this week. Its lowest level coincided with the lowest points of October and November.
Ripple price has also formed an inverse head and shoulders pattern, a common bullish reversal sign. In this case, its shoulder is the descending trend line that connects the swings higher since October.
A closer look shows that the token has formed a bullish engulfing pattern, which consists of a large bullish candle completely covering a small bearish candle. It is one of the most common bullish reversal signs in technical analysis.