Bitcoin (BTC) is heading towards its worst monthly loss since mid-2022, with BTC down around 18.5% in June as the price struggles to maintain the psychological support level of $60,000.
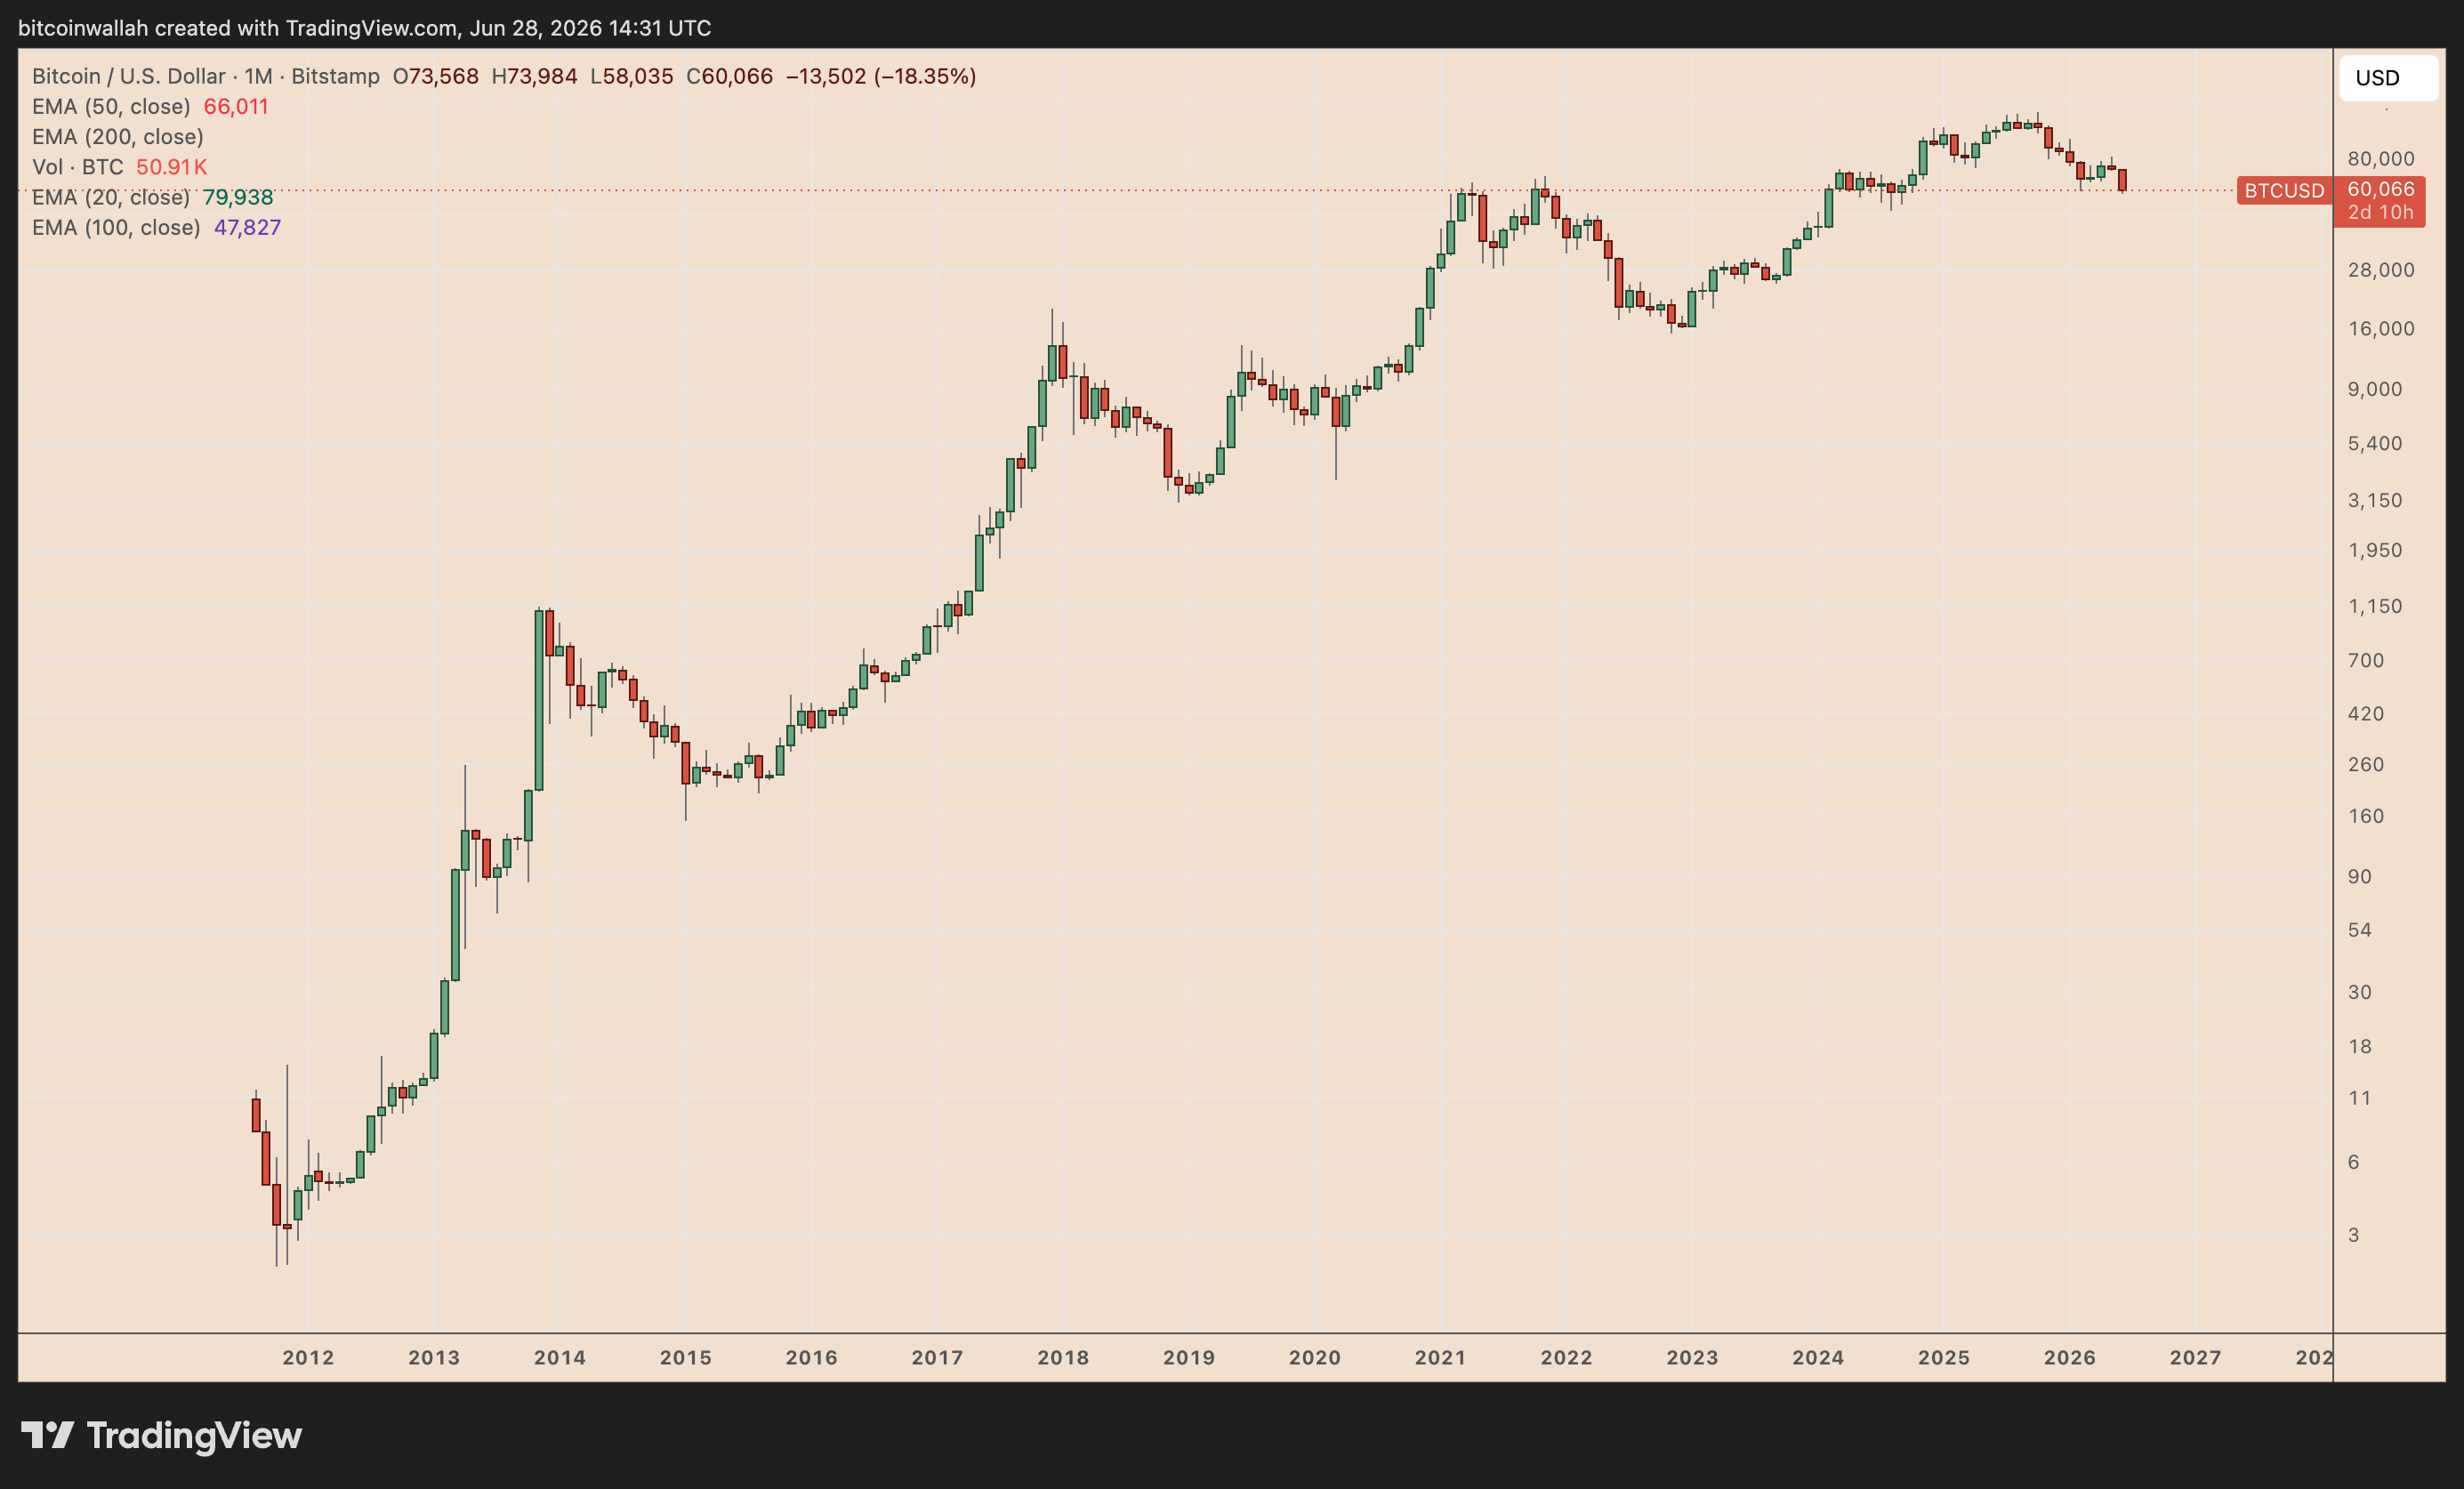
BTC/USD monthly chart. Source: Trading View
Will Bitcoin’s bearish momentum continue in July, or is BTC preparing for a recovery?
Key points to remember:
- Bitcoin’s liquidity map shows a major short liquidation “magnetic zone” near $67,600.
- BTC has historically gained 7.6% on average in July, while mid-year seasonality points to an even stronger average return of 10.3%.
Bitcoin Could Hit $75,000 in July
July Could Become a “Bullish Month for Bitcoin,” Says Analyst Flehwhich predicts that the price of BTC will climb towards $75,000 next month.
The bullish thesis is based on Bitcoin’s Binance BTC/USDT liquidation heatmap, which shows a large concentration of short liquidation levels located above the current price.
On the monthly chart, the largest visible liquidity cluster is near $67,645, where the chart shows approximately $247.39 million in liquidation leverage and approximately $2.26 billion in cumulative liquidation leverage in the short term.
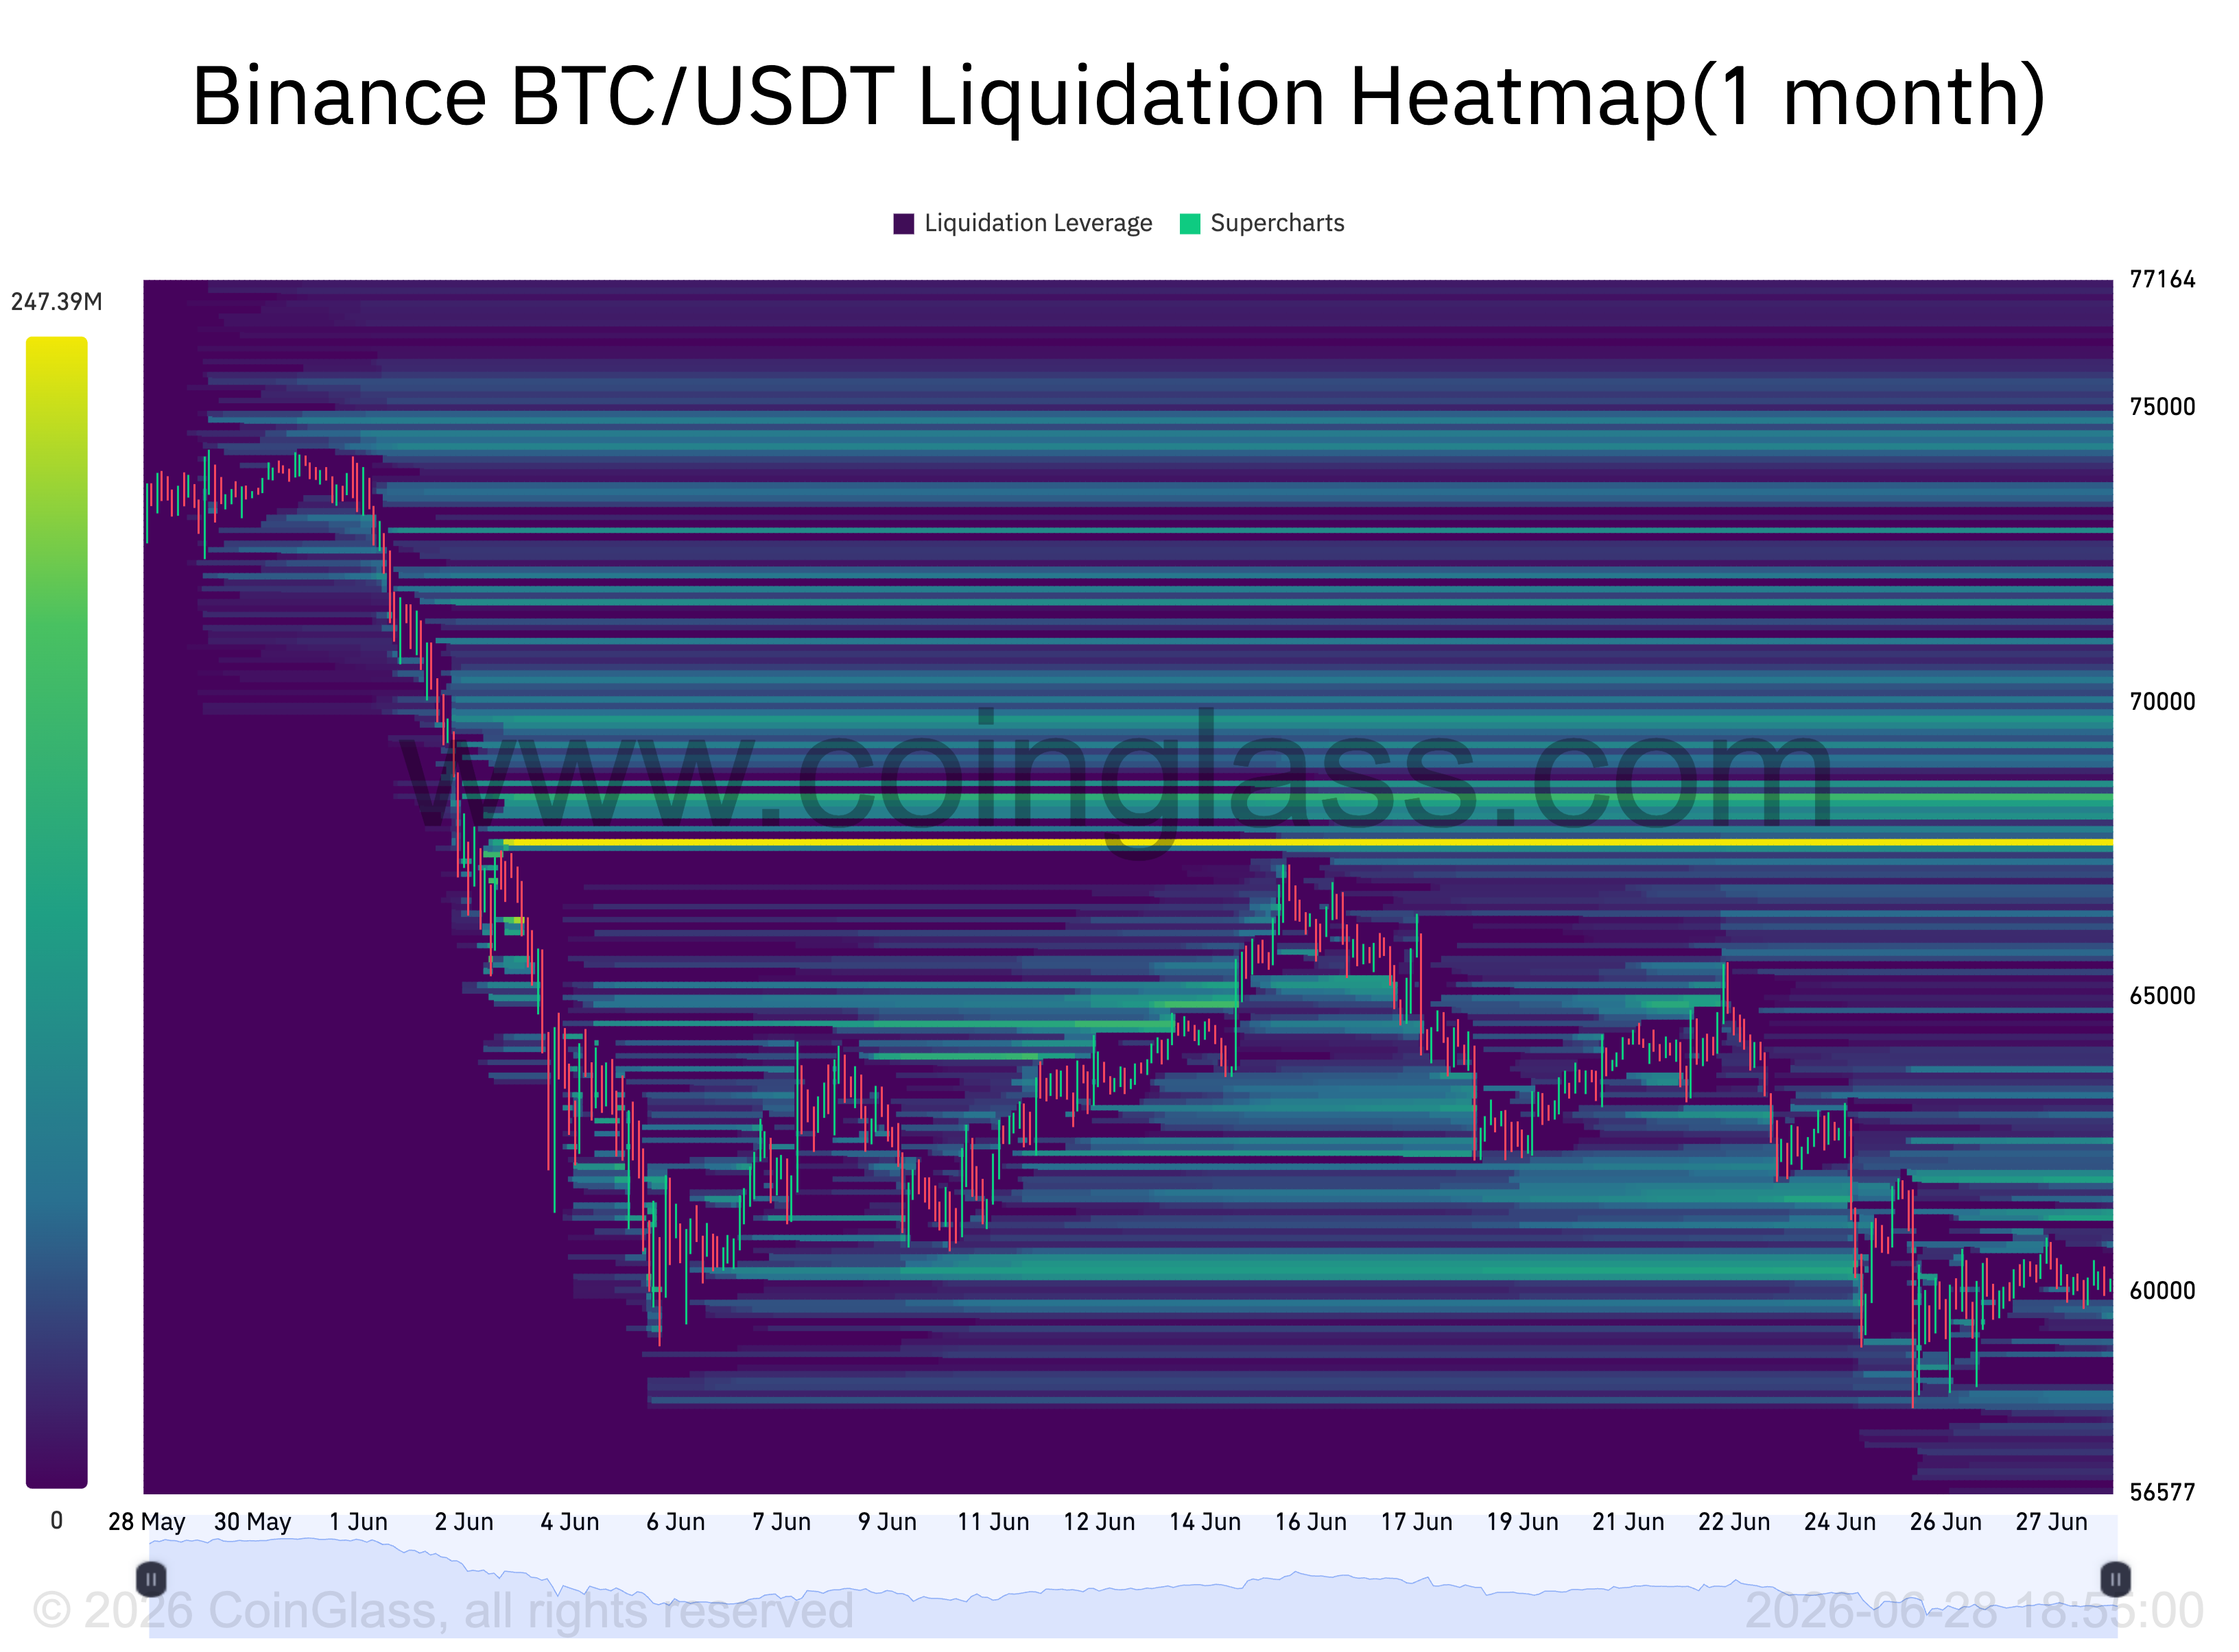
Binance BTC/USDT liquidation heatmap (1 month). Source: CoinGlass
For beginners, these clusters are often called “magnetic zones”. When many leveraged positions are concentrated around the same price zone, the market can move toward that zone because liquidations create forced buying or selling pressure.
In this case, significant liquidity lies above the current Bitcoin price near $60,000.
If BTC rebounds and hits $67,600, short sellers may be forced to close their positions. Since closing short positions requires Bitcoin to be repurchased, this may add further upward pressure and fuel a short squeeze.
“I think $BTC peaks here at 60,000 for now, aiming for 75,000 on the upside before any chance of decline,” Fleh said in a Saturday post.
BTC increases by 7.6% on average in July
Bitcoin’s historic monthly returns also support Fleh’s bullish outlook for July.
BTC saw an average gain of 7.6% in July, making it one of its strongest months after a generally weaker June, which saw an average return of -1.40%, according to CoinGlass data highlighted by the analyst. CGT_Trader.
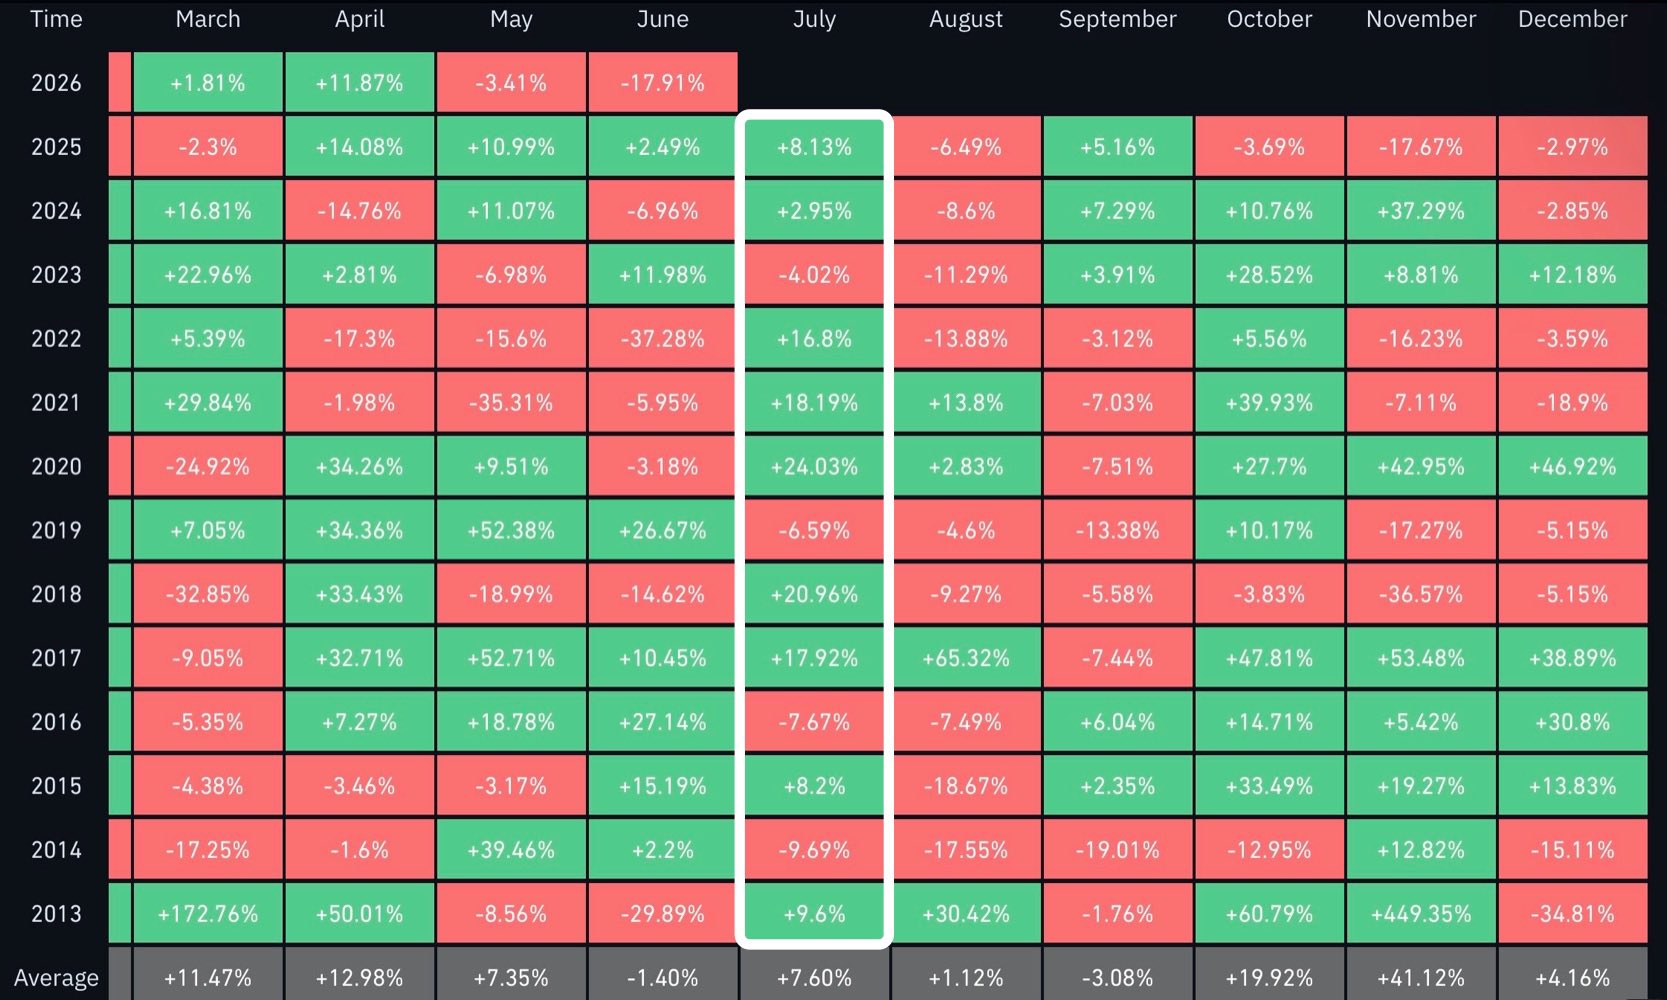
Monthly Bitcoin returns have tracked July performance since 2013. Source: CoinGlass/CGT_Trader
This trend appeared even during bear market years.
For example, Bitcoin rose 20.96% in July 2018 and 16.8% in July 2022. Most recently, BTC gained 2.95% in July 2024 and 8.13% in July 2025, strengthening the case for another green month ahead.
A separate mid-year seasonality chart also shows that Bitcoin averaged a 10.3% gain during the month, its highest monthly return in those years.
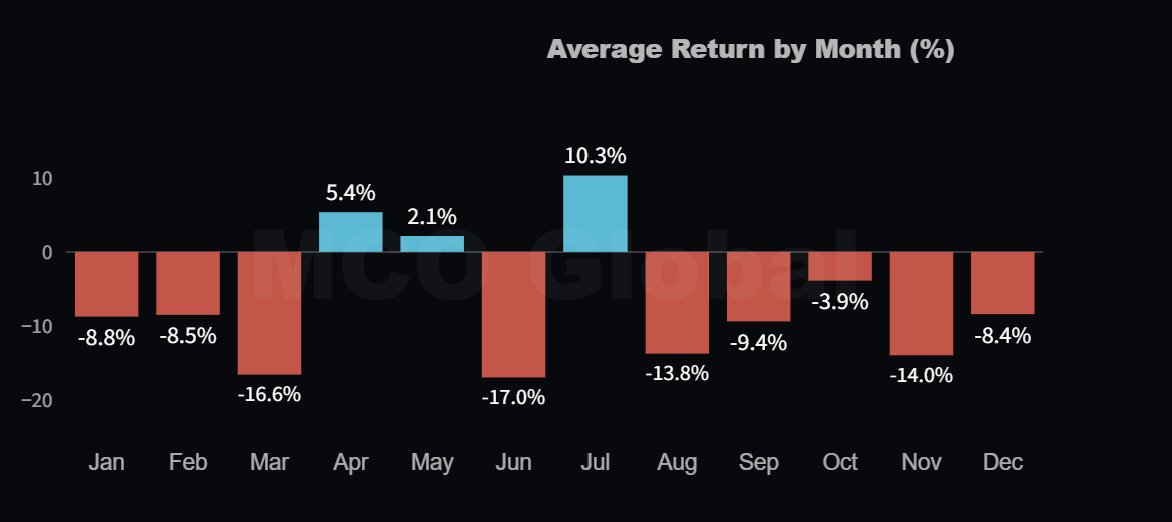
Bitcoin performance by month during US midterm election years. Source: More Crypto Online
This compares to an average loss of 17% in June, raising the possibility of a mean-reversion rebound following the sell-off.
Based on Bitcoin’s current price near $60,000, its historical average return of 7.6% in July projects a move toward around $64,500, while the higher mid-year average of 10.3% points to around $66,100.
A repeat of Bitcoin’s July bear market bounces between 2022 and 2018 would put BTC between $70,000 and $72,500, while a 2020-style July rally would bring Fleh’s $75,000 target closer.
BTC falling below 200-week SMA could extend decline
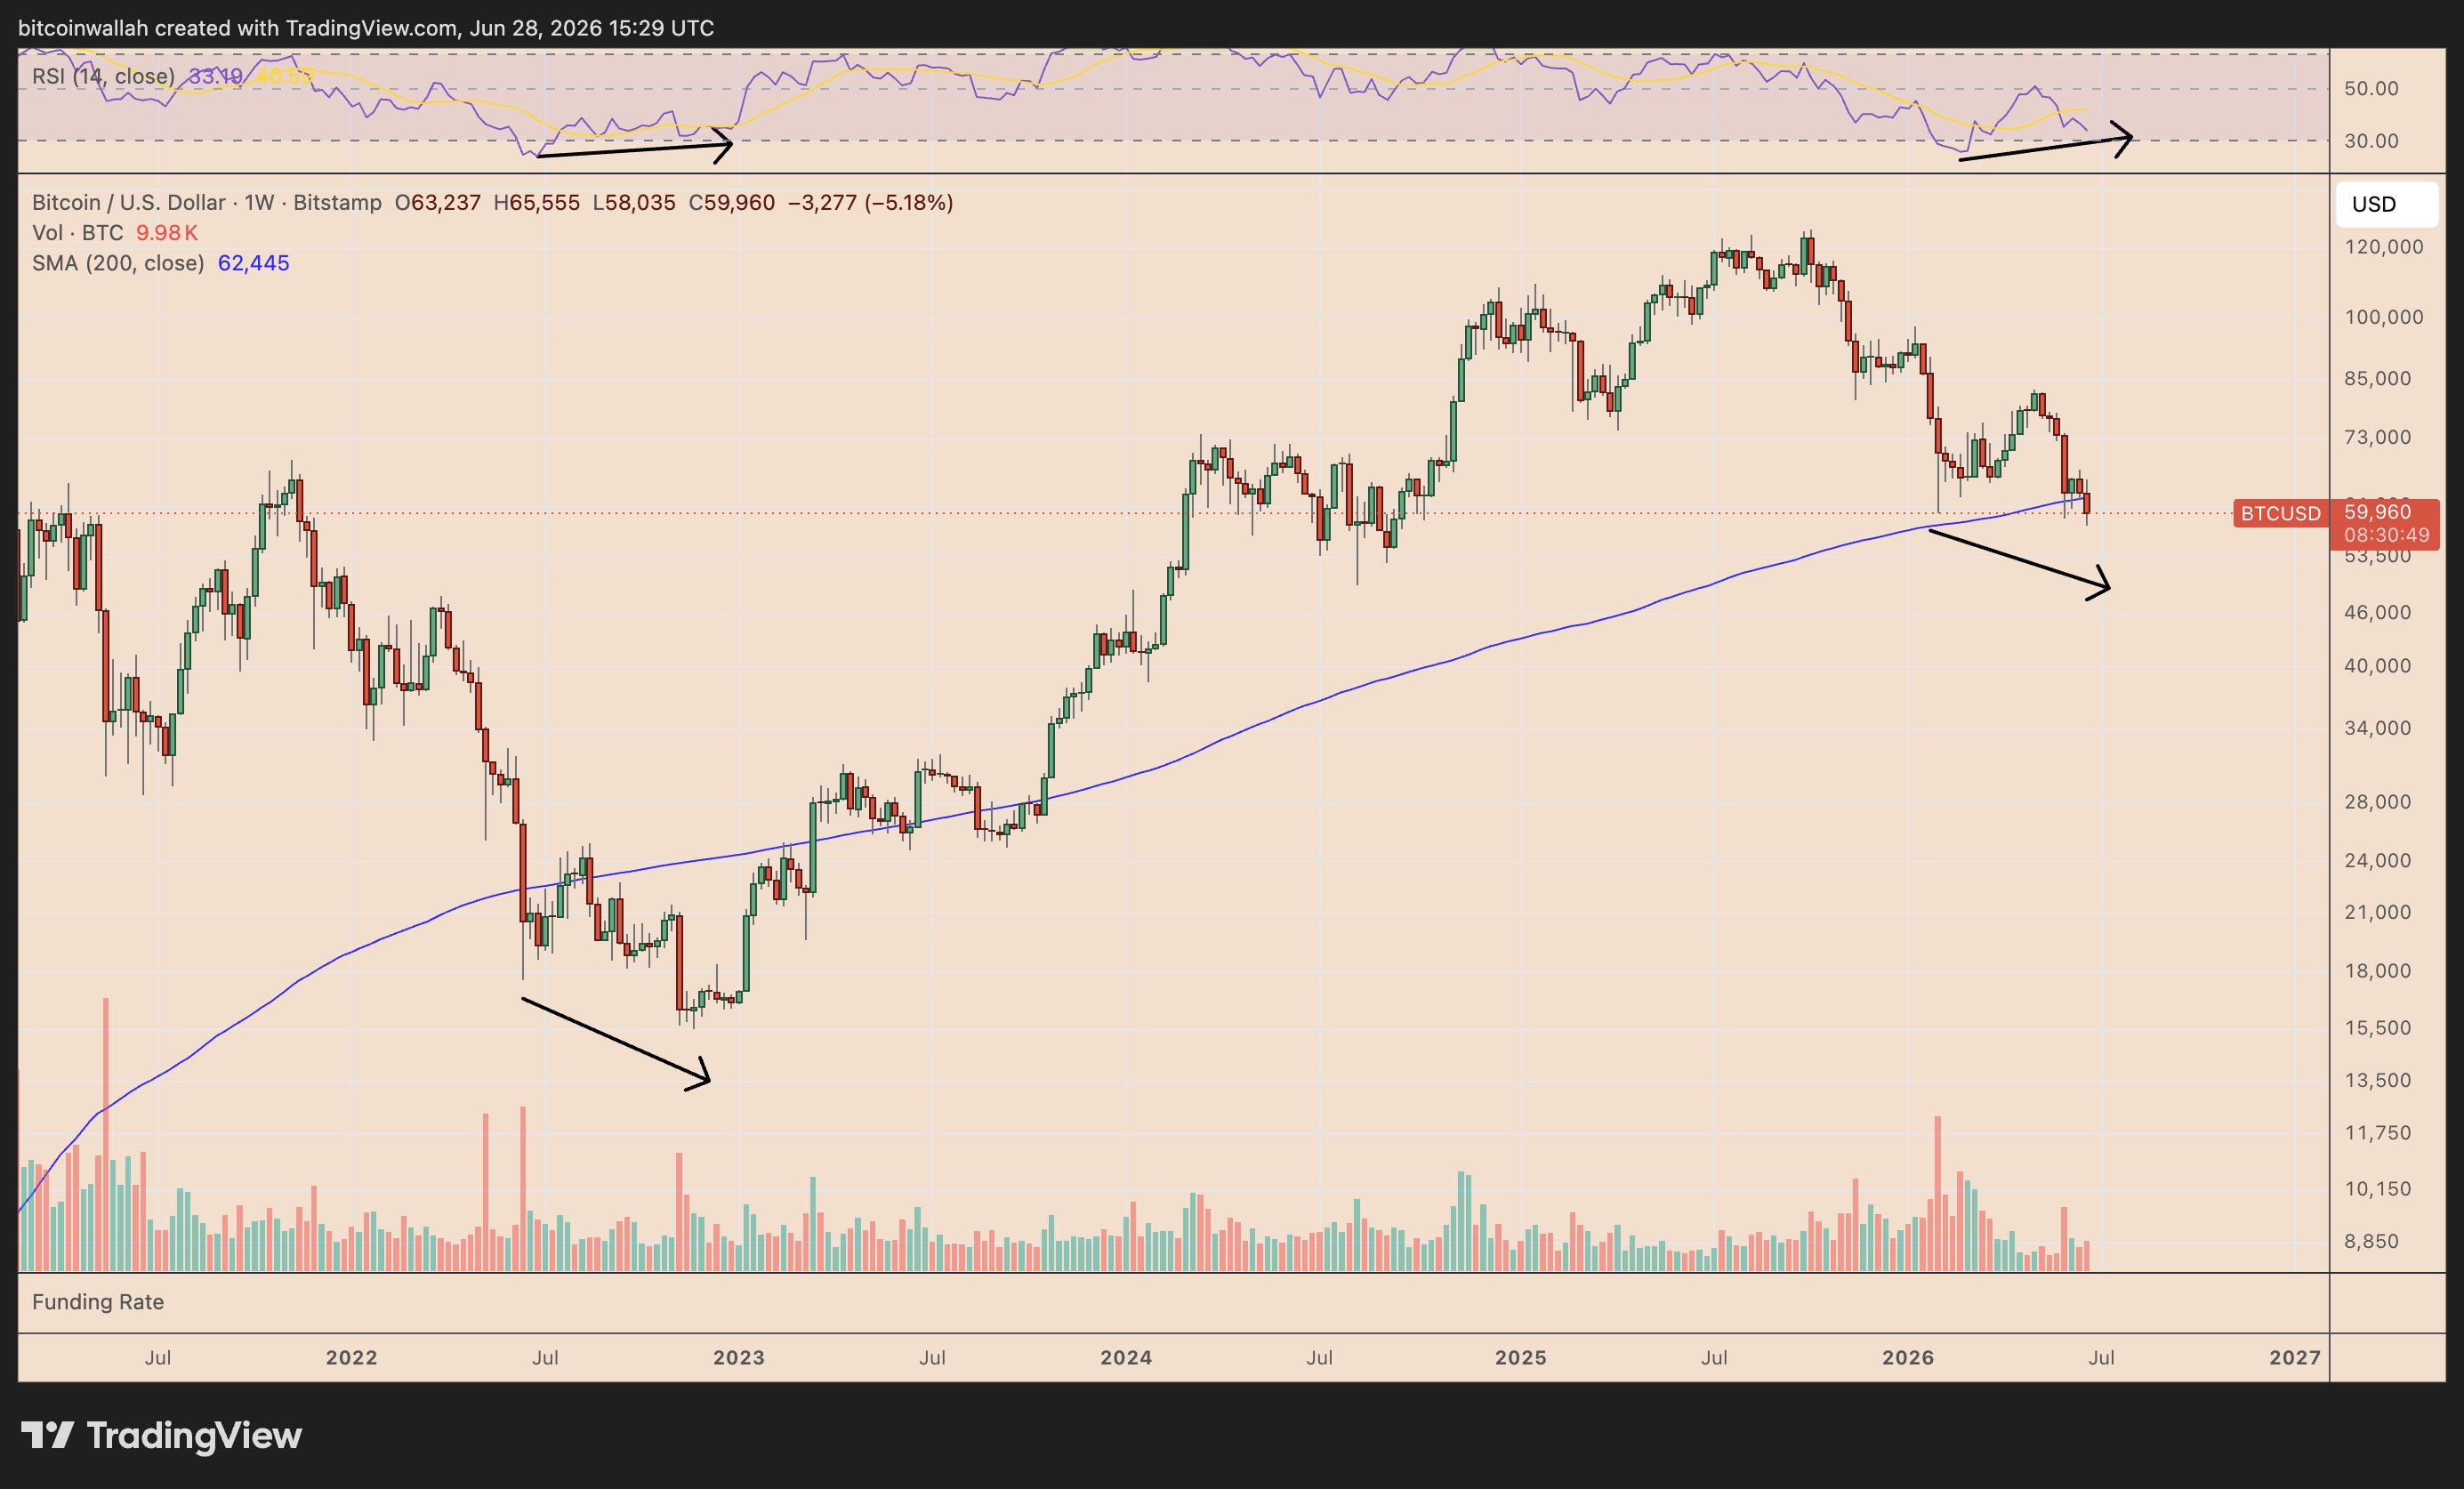
Bitcoin’s continued fall below its 200-week simple moving average (200-day SMA, the blue line) near $62,445 increases the risk of further decline in July.
BTC/USD weekly chart. Source: TradingView
A similar loss of long-term moving average support preceded deeper weakness during the 2022 bear market, when BTC continued to decline before forming a bottom.
Related: Bitcoin faces new risk of capitulation as 50,000 BTC trades at a loss
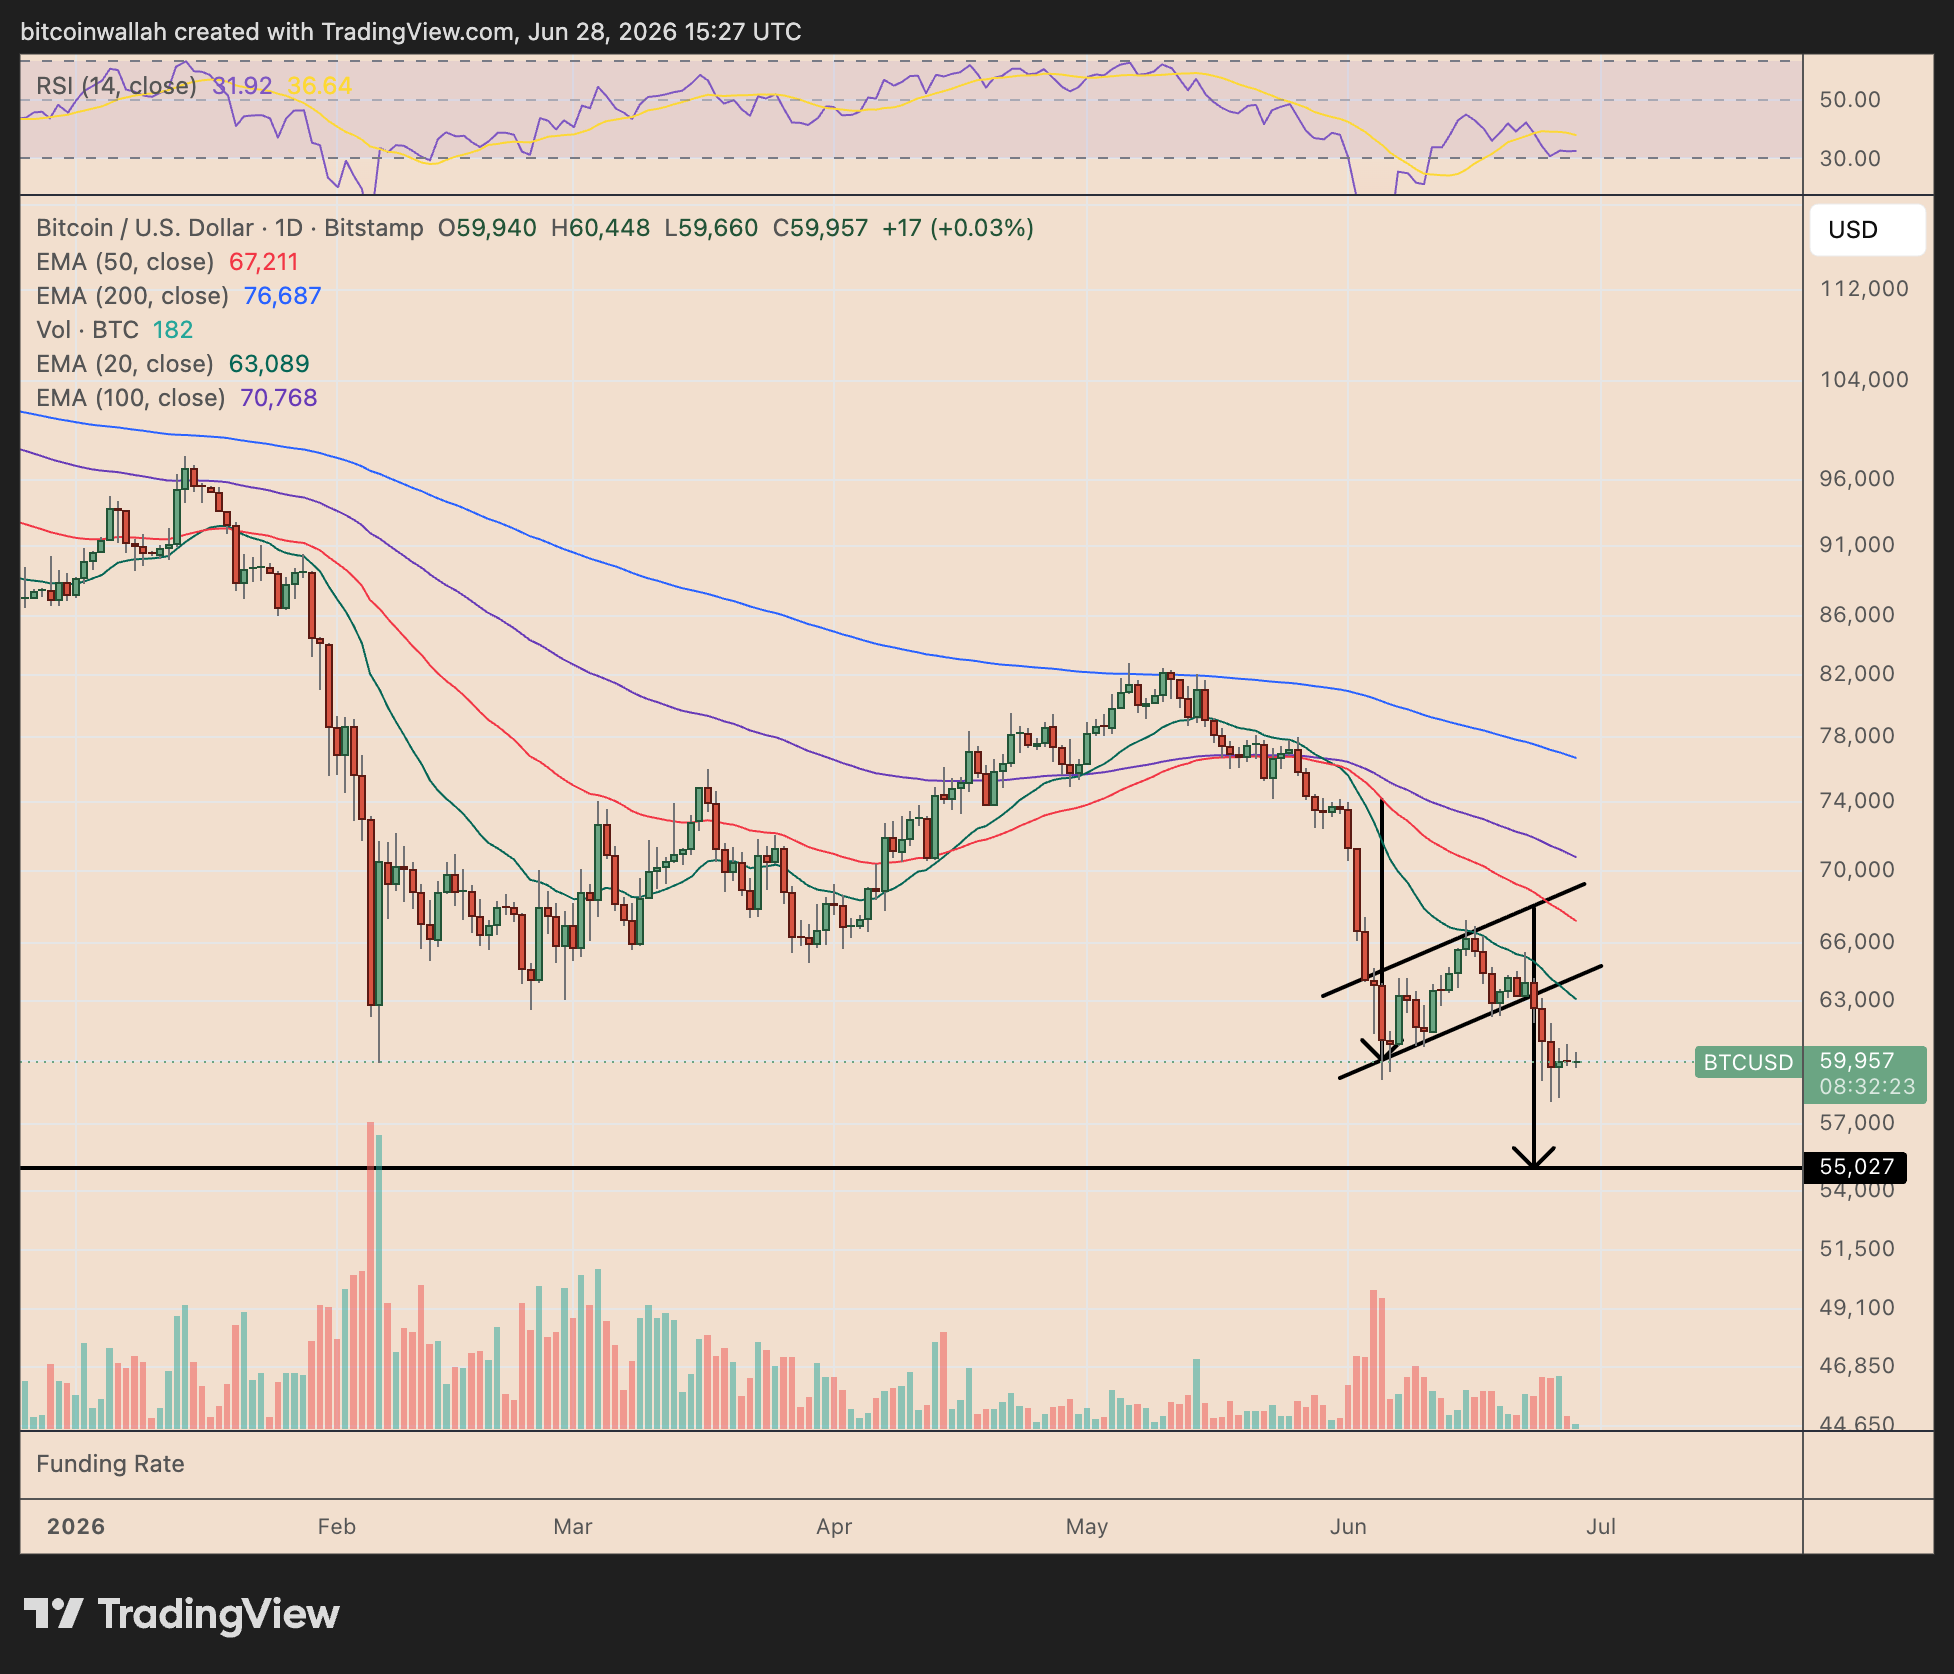
Breaking Bitcoin’s bearish flag increases the chances of a price decline to $55,000 in July unless BTC quickly reclaims the 200-day SMA.
BTC/USD daily chart. Source: TradingView