
Ethereum price is trying to stabilize after a difficult February, but the bigger question is whether this bounce is strong enough to break the $2,500 ceiling.
Summary
- Ethereum has rebounded above $2,000 after a sharp drop in February, but remains in a broader downtrend and well below the key resistance at $2,500.
- Funding rates on Binance have turned positive, easing short-term bearish pressure, although high volatility suggests a larger move is coming.
- To Reclaim $2,500, ETH Must Hold $2,000 Support and Break $2,200 With Strong Momentum
At the time of this publication, ETH was trading near $2,050, up about 3% in the last 24 hours. The move extends a one-week rally of about 9%. Even so, the token is still down 30% over the past month and sits almost 58% below its August 2025 high of $4,946.
February started with Ethereum (ETH) trading between $2,200 and $2,400 before sellers took control mid-month. The decline accelerated around February 24 and 25, when the price fell to $1,800. Buyers have since intervened again, pushing the price above the $2,000 mark.
Volatility reaches its highest level since March 2025
The data derived shows a notable change in positioning. According to a report from February 26 analysis According to CryptoQuant analyst PelinayPA, funding rates remained positive for an extended period earlier this year, indicating that long traders were paying short.
Despite that optimism, the price failed to generate a consistent rally. More recently, when short positions grew and the price faced pressure, funding turned sharply negative.
Binance, which holds the majority of global derivatives liquidity, often sets the tone during selloff waves. Ethereum’s short to medium-term trajectory is often affected by changes in Binance’s funding.
Funding is now back to positive. This indicates that there is less immediate bearish pressure now that many short positions have been liquidated. However, positive financing does not demonstrate long-term recovery. The market could experience a prolonged contraction if it rises too quickly.
In a separate report, analyst Arab Chain revealed Ethereum’s 30-day realized volatility on Binance has risen to around 0.97, its highest level since March 2025.
This high volatility often precedes a significant directional move, but if buying and selling pressure is evenly distributed, it can also occur during a prolonged period of sideways trading.
Ethereum Price Technical Analysis
From a chart perspective, ETH is still on a clear day downward trendmarked by lower highs and lower lows. The price recently bounced after touching the Lower Bollinger Band near the $1,850 to $1,900 zone. It is now trading around $2,050, below key resistance areas.
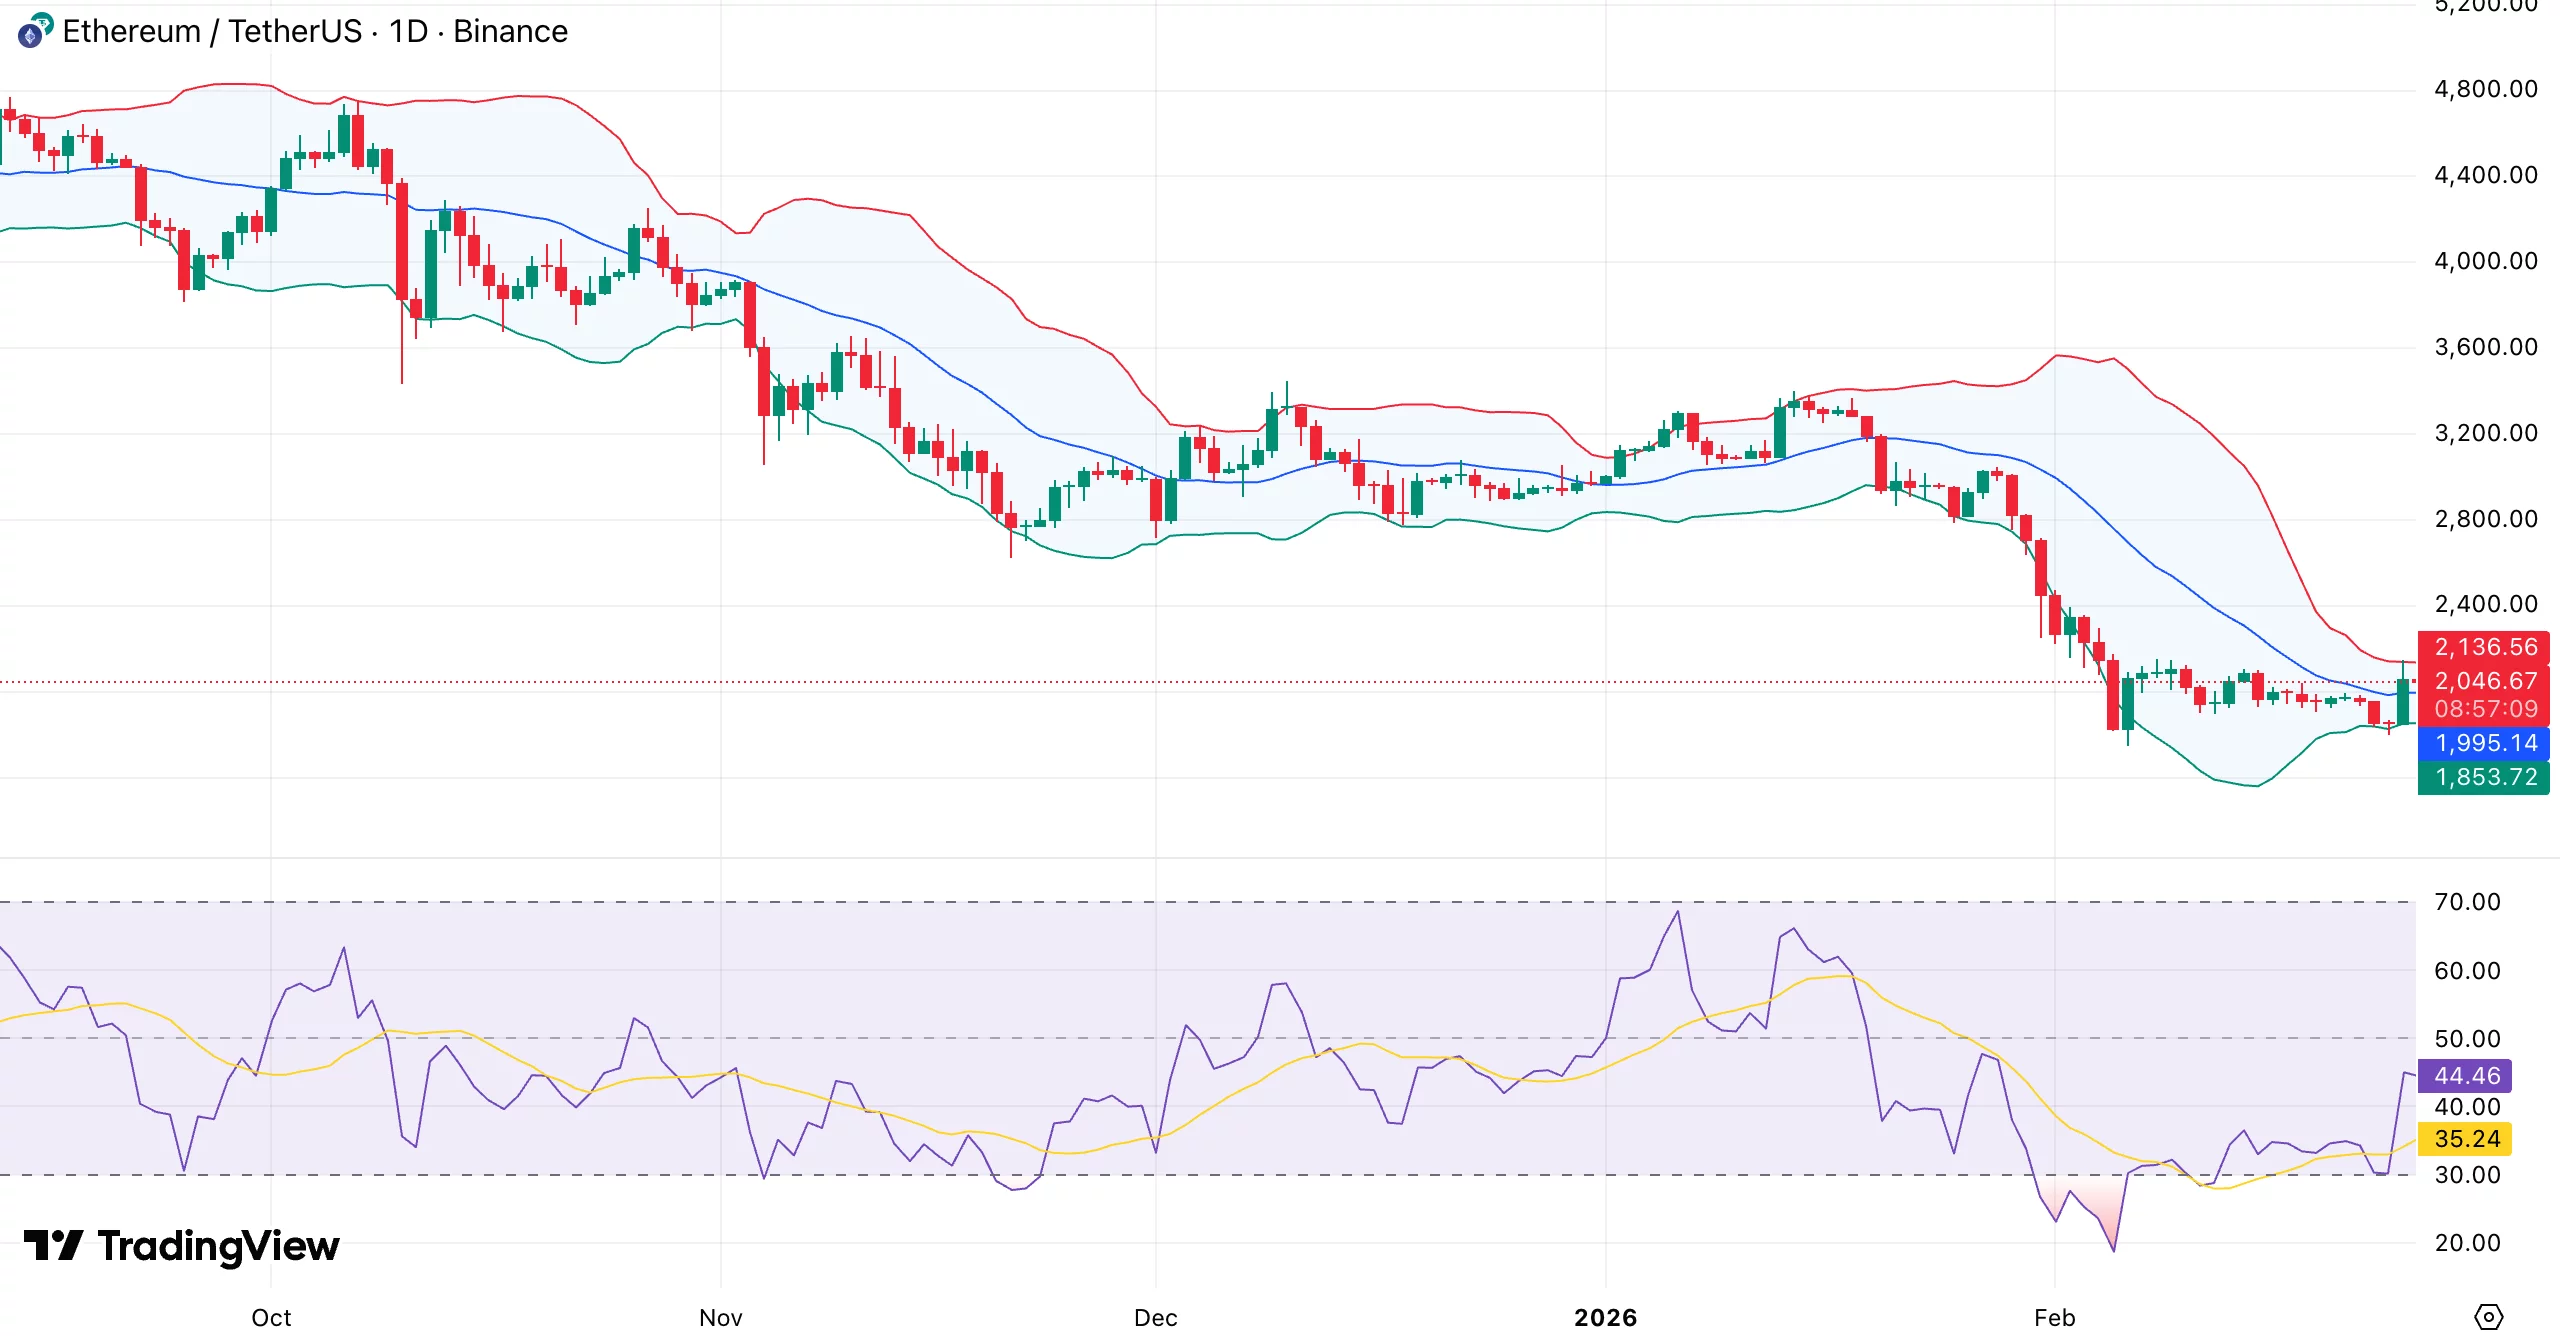
Immediate support lies near $2,000, followed by the recent low between $1,850 and $1,900. On the positive side, the offer is grouped between $2,130 and $2,150, and then between $2,300 and $2,350.
Because it corresponds to a previous breakout area and has psychological weight, the $2,500 level remains the main structural barrier.
Momentum is improving, but not decisive yet. Following a recovery from oversold conditions, the relative strength index is approaching 44.
A sustained move above 50 would strengthen the case for a change in momentum. Bollinger Bands are starting to narrow after widening during the sell-off, suggesting a possible breakout attempt.
For Ethereum to reclaim $2,500, it must break above the $2,200 area with substantial volume and hold above $2,000 to form a higher low. The current move could turn into a relief bounce within a larger bearish structure if there is no follow-through.