
Pi Network price is becoming increasingly bearish as the distribution strengthens throughout the current trading range, increasing the probability of a correction towards the key support level of $0.20.
Summary
- The failed breakout and bearish engulfing candle confirm the distribution within the current range.
- The price is struggling to move below multiple resistance levels including the $0.618 and $0.25 Fibonacci level.
- Losing the checkpoint increases the probability of a drop towards the low of the $0.20 value area.
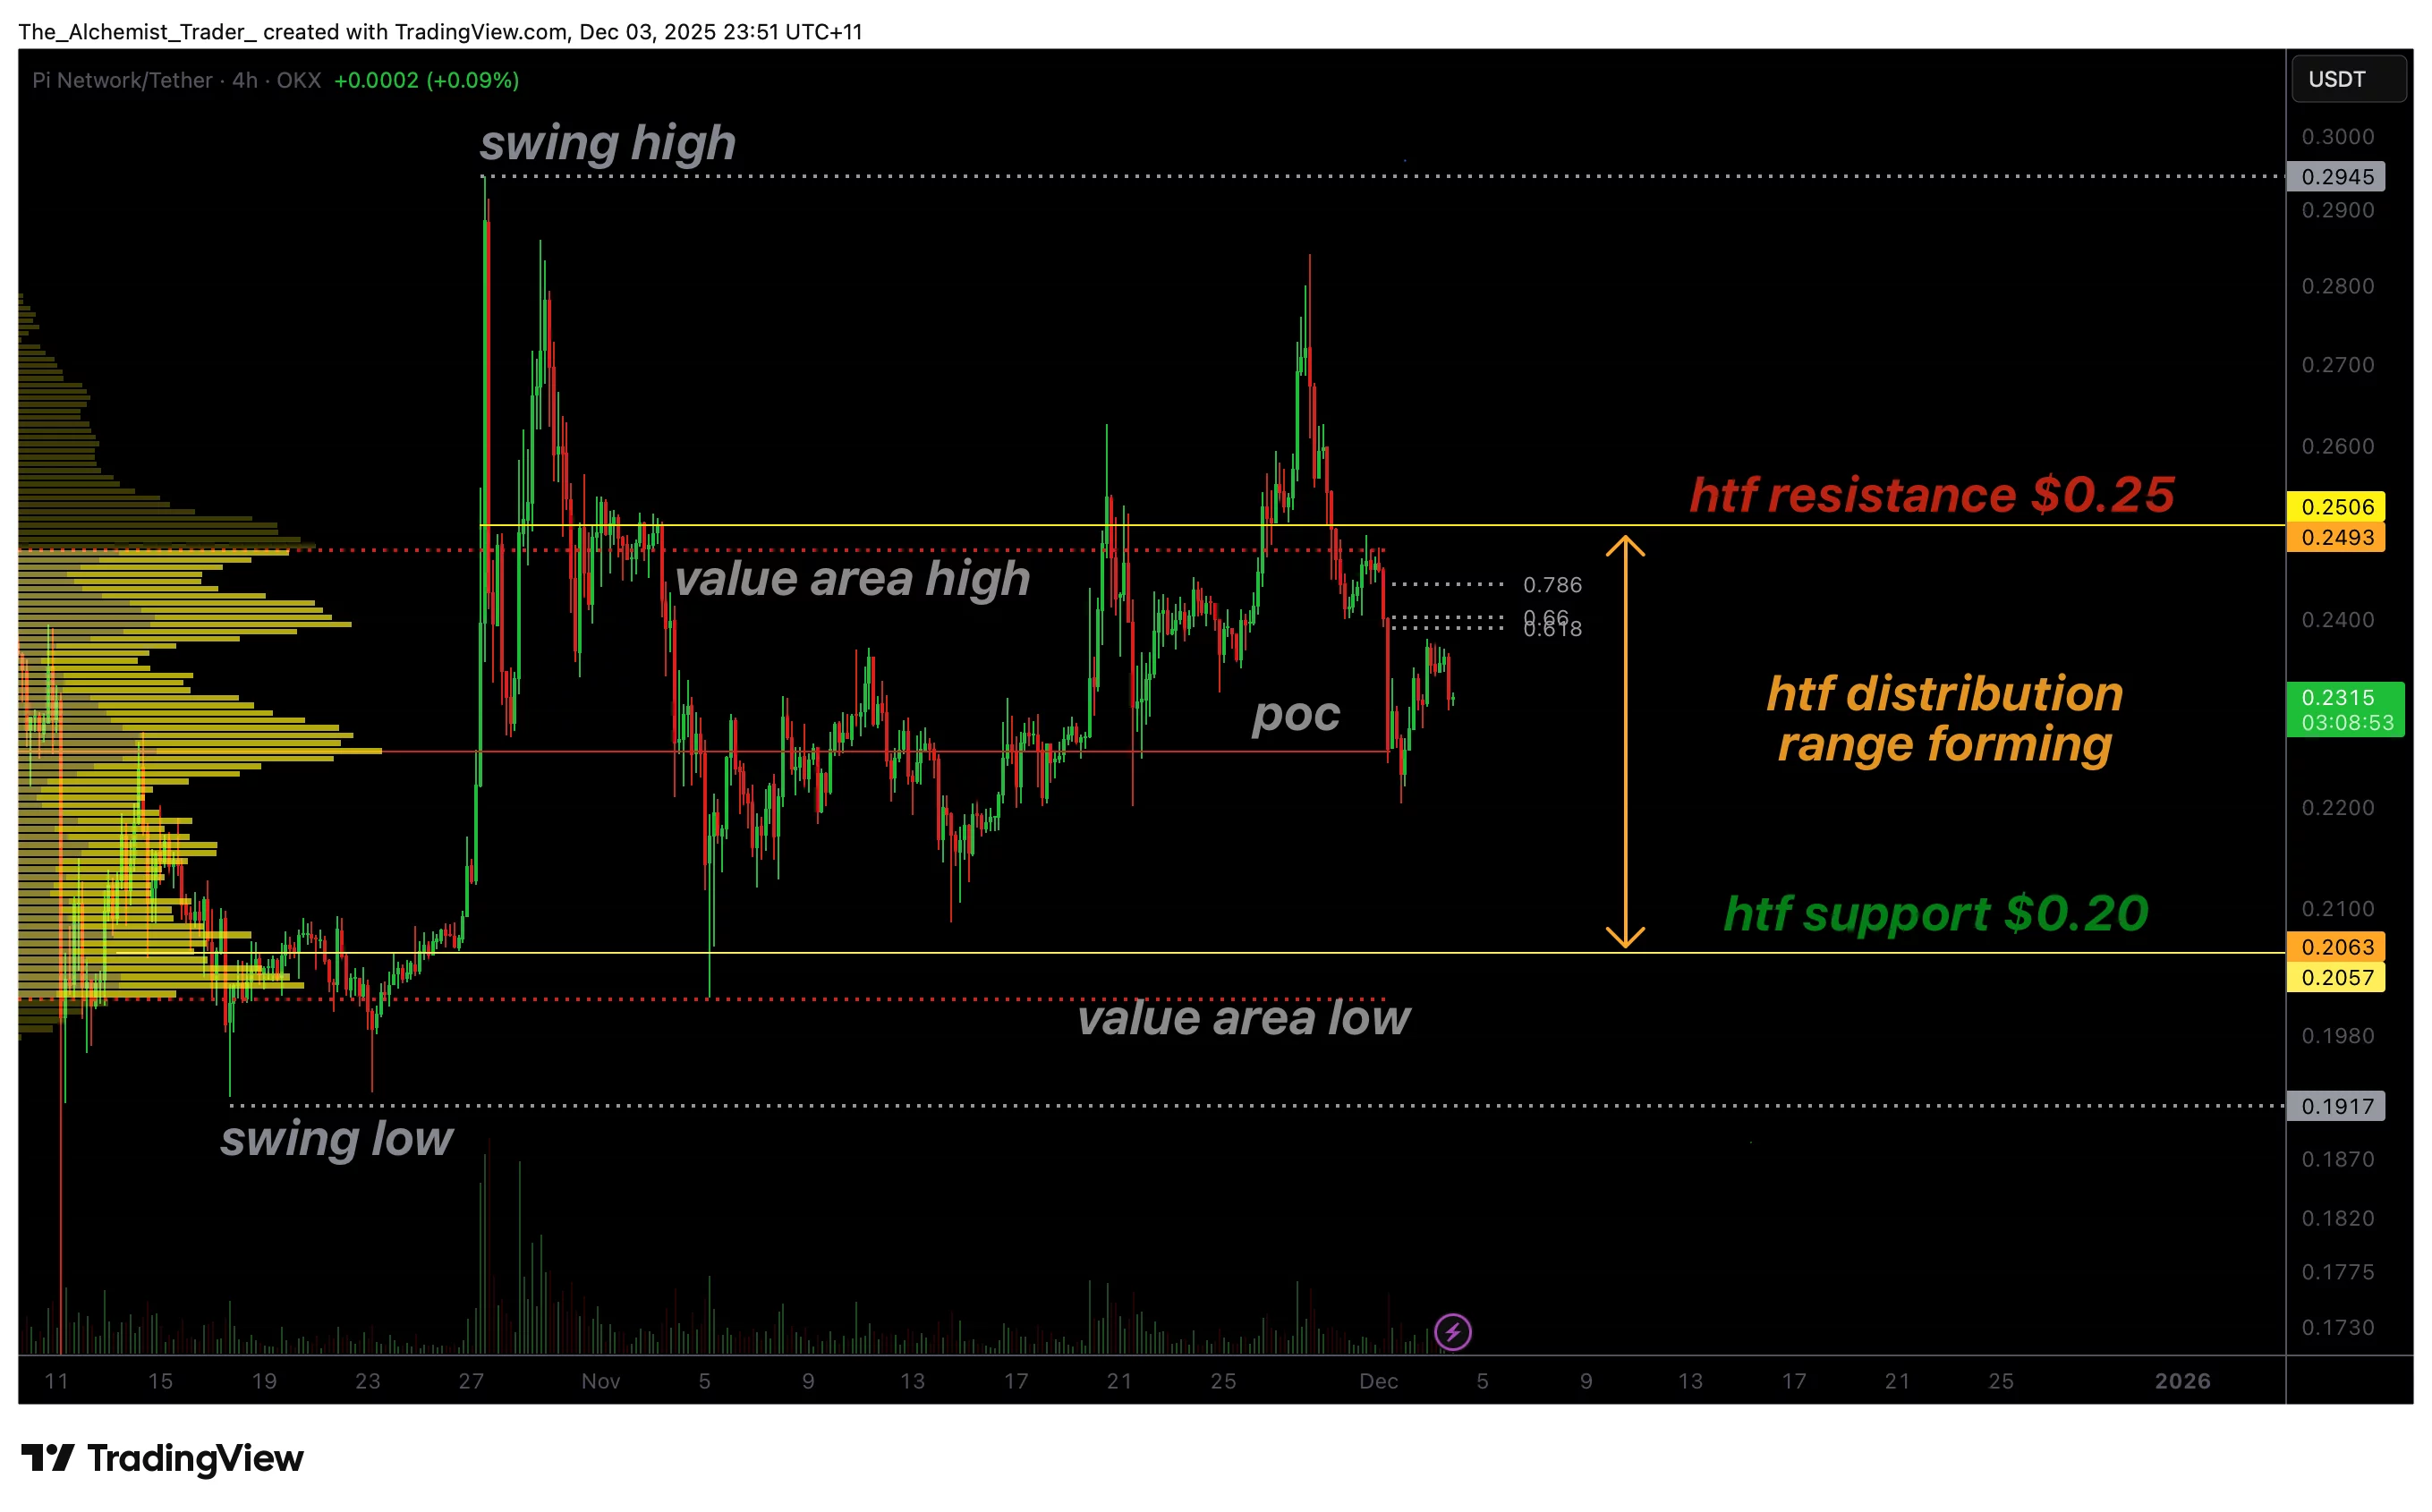
Pi Network Price (PI) is showing signs of weakness as the price action moves deeper into a developing distribution phase. The asset is now trading below key long-term resistance levels, indicating that buyers have lost control of the upper bound of the range.
The pullback within the established trading range invalidated the recent breakout attempt and realigned the downward momentum. With structural supports now under pressure, Pi Network faces a growing risk of a full rotation towards the range low near $0.20.
Key Technical Pi Network Price Points
- The price is trading below the high time frame resistance and the value area is high, indicating stronger bearish momentum.
- The failed breakout and bearish engulfing candle reflect a lack of demand outside the established range.
- The control point is weakening as the price struggles below the 0.618 Fibonacci resistance level.
Recently, Pi Network failed to sustain a breakout above its high time frame resistance, creating one of the clearest early signs of distribution formation on the entire chart. The rejection pushed the price back into the trading range, where a large bearish engulfing candle confirmed that sellers remain firmly in control.
The lack of bullish follow-through during the breakout attempt demonstrated that demand was insufficient once the price moved out of the range, resulting in an immediate reversal and aggressive re-entry into the range.
This re-entry caused the price to return to the control point, the level that historically acts as the midpoint of trading activity. While the Pi Network has shown a minor bounce from this area, the reaction has been weak and the bullish momentum has not developed significantly.
This even comes as Pi Network affirms MiCA compliance in the search for regulated listings on EU stock exchanges, a development that has not yet influenced short-term price behavior. The price continues to struggle below the 0.618 Fibonacci retracement level, which currently serves as a local resistance zone just below the broader $0.25 level. The confluence of these resistances puts downward pressure, reducing the likelihood of a sustained recovery.
The next significant support lies at the low of the value area, which aligns closely with the $0.20 region. This area represents the lower limit of the current trading range and acts as a structural anchor for the price. If Pi Network loses the checkpoint at the daily close, a rotation towards the low of this value area becomes the most likely scenario.
Importantly, liquidity remains below the $0.20 region, increasing the incentive for the price to move aggressively towards this area. The current bearish structure, combined with weak buying pressure and repeated failures to reclaim key resistances, suggests that the market may be preparing to absorb that liquidity.
This vulnerability is amplified by concerns about whether the next 190 million tokens could be unlocked trigger an even steeper drop in the price of Pi Network. The price action has consistently posted lower highs on short-term periods, further confirming that momentum remains tilted to the downside.
What to expect from the next price action
If the checkpoint fails on the close, Pi Network is likely to turn towards the low of the value area near $0.20. Only a strong recovery from resistance and increased bullish volume would negate this bearish trajectory.