
Chainlink price rallied more than 14% on Wednesday, reaching its highest level since February 5.
Chain link (LINK) token rose to a high of $9.35, up more than 30% from its lowest level this month. This rally has raised its market capitalization to more than $6.6 billion.
Top Reasons Why LIN Price Is Soaring
Chainlink price rose as crypto market rally resumed, with Bitcoin and most altcoins in the green. Bitcoin jumped to $67,000, while the market cap of all tokens rose more than 5% to over $2.33 trillion.
The LINK token is also benefiting from sustained demand from US investors. Data compiled by SoSoValue shows that LINK spot ETFs have accumulated more than $10 million in assets this month, bringing their cumulative total to more than $85 million.
These funds now have more than $71 million in assets, and Grayscale’s GLNK has $61 million. Bitwise’s CLNK has $9.75 million in assets. By contrast, Bitcoin and Ethereum spot ETFs have shed billions of assets in recent months.
Chainlink price is also rising after integrating with Canton, one of the biggest players in the real-world asset tokenization industry. The integration introduces stock data streams, smart data, proof of reserves and CCIP.
Other recent integrations into the network include Robinhood, Arc, the layer 1 network built by Circle, World, and MagaEth.
Meanwhile, Chainlink has continued to accumulate LINK tokens as part of its LINK Strategic Reserves. Data shows that these reserves have increased to over 2.17 million and are currently worth over $19.7 million. These purchases will continue to grow in the coming years as Chainlink plans to use its off-chain fees to accumulate more tokens.
Still, the main risk is that Chainlink’s current price rally is a dead cat bounce, also known as a bull trap. A bull trap is a situation where a free-falling asset recovers and then resumes the downtrend.
Chainlink Price Prediction: Technical Analysis
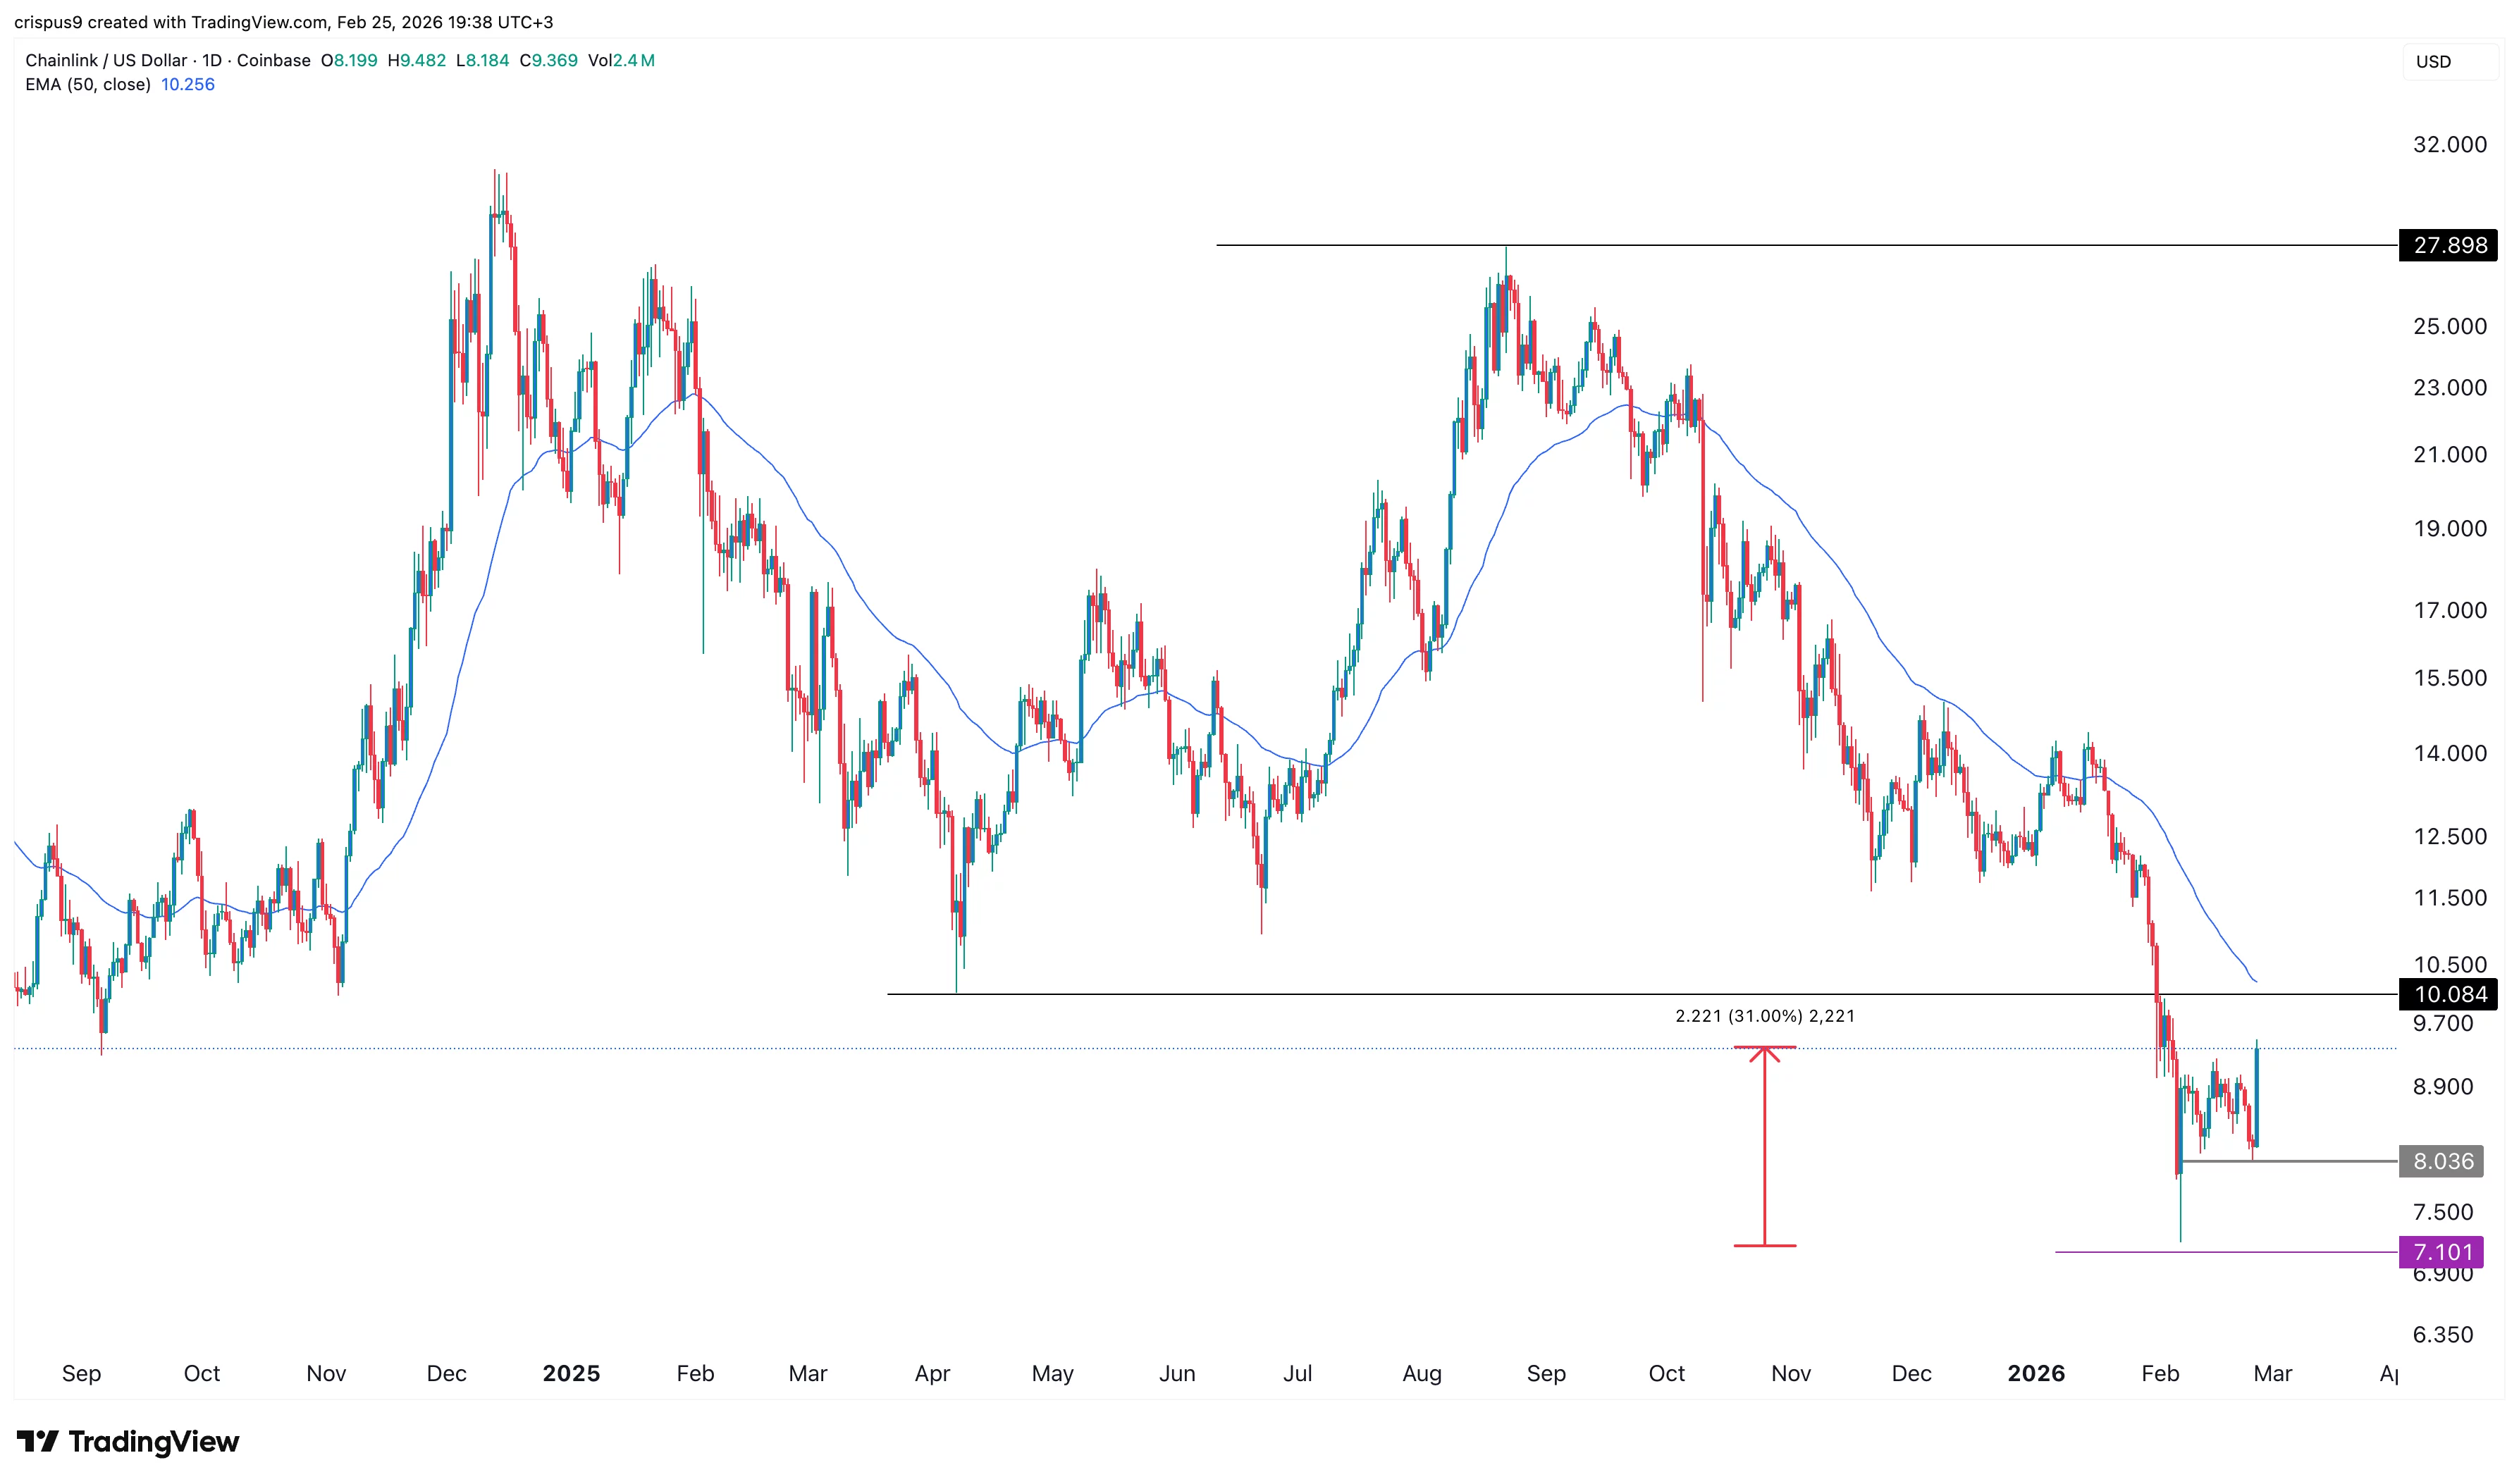
The daily time chart shows that LINK price has remained in a bear market in recent months despite its strong fundamentals.
It fell from a high of $27 to the current $9.4. It has remained below all moving averages and the key support level of $10, which was its lowest level on April 6 last year.
LINK price remains below the 50-day and 100-day exponential moving averages and the supertrend indicator. Additionally, it formed a small double bottom pattern at $8.036 and a neckline at $9.18.
Therefore, the most likely scenario is that it will remain under pressure in the coming weeks as risks, including the potential attack on Iran, stay. A full rebound will be confirmed if it breaks the key resistance level of $10 and flips the short and medium-term moving averages.