Bitcoin price is once again testing the upper limit of its trading range near $72,000, where selling pressure has historically emerged.
Summary
- Range resistance: Bitcoin is struggling to break above the range high of $72,000.
- Rejection signal: A developing daily wick suggests weakening bullish momentum.
- Downside risk: A confirmed rejection could rotate the price towards the $50,000 support.
Bitcoin (btc) price action is currently positioned at a technically significant inflection point as the asset is trading near the upper limit of its established trading range. The $72,000 region has repeatedly acted as strong resistance on the daily chart, preventing sustained bullish continuation.
While Bitcoin has attempted to challenge this level again, the latest candles suggest early signs of rejection, indicating that the market may remain trapped within its broader consolidation structure.
Key Bitcoin Price Technical Points
- High range resistance: $72,000 continues to limit bullish momentum on the daily chart.
- Rejection signal: A developing rejection fuse suggests weakening bullish momentum.
- Downside risk: A close below the value area high could trigger a rotation towards lower range support.
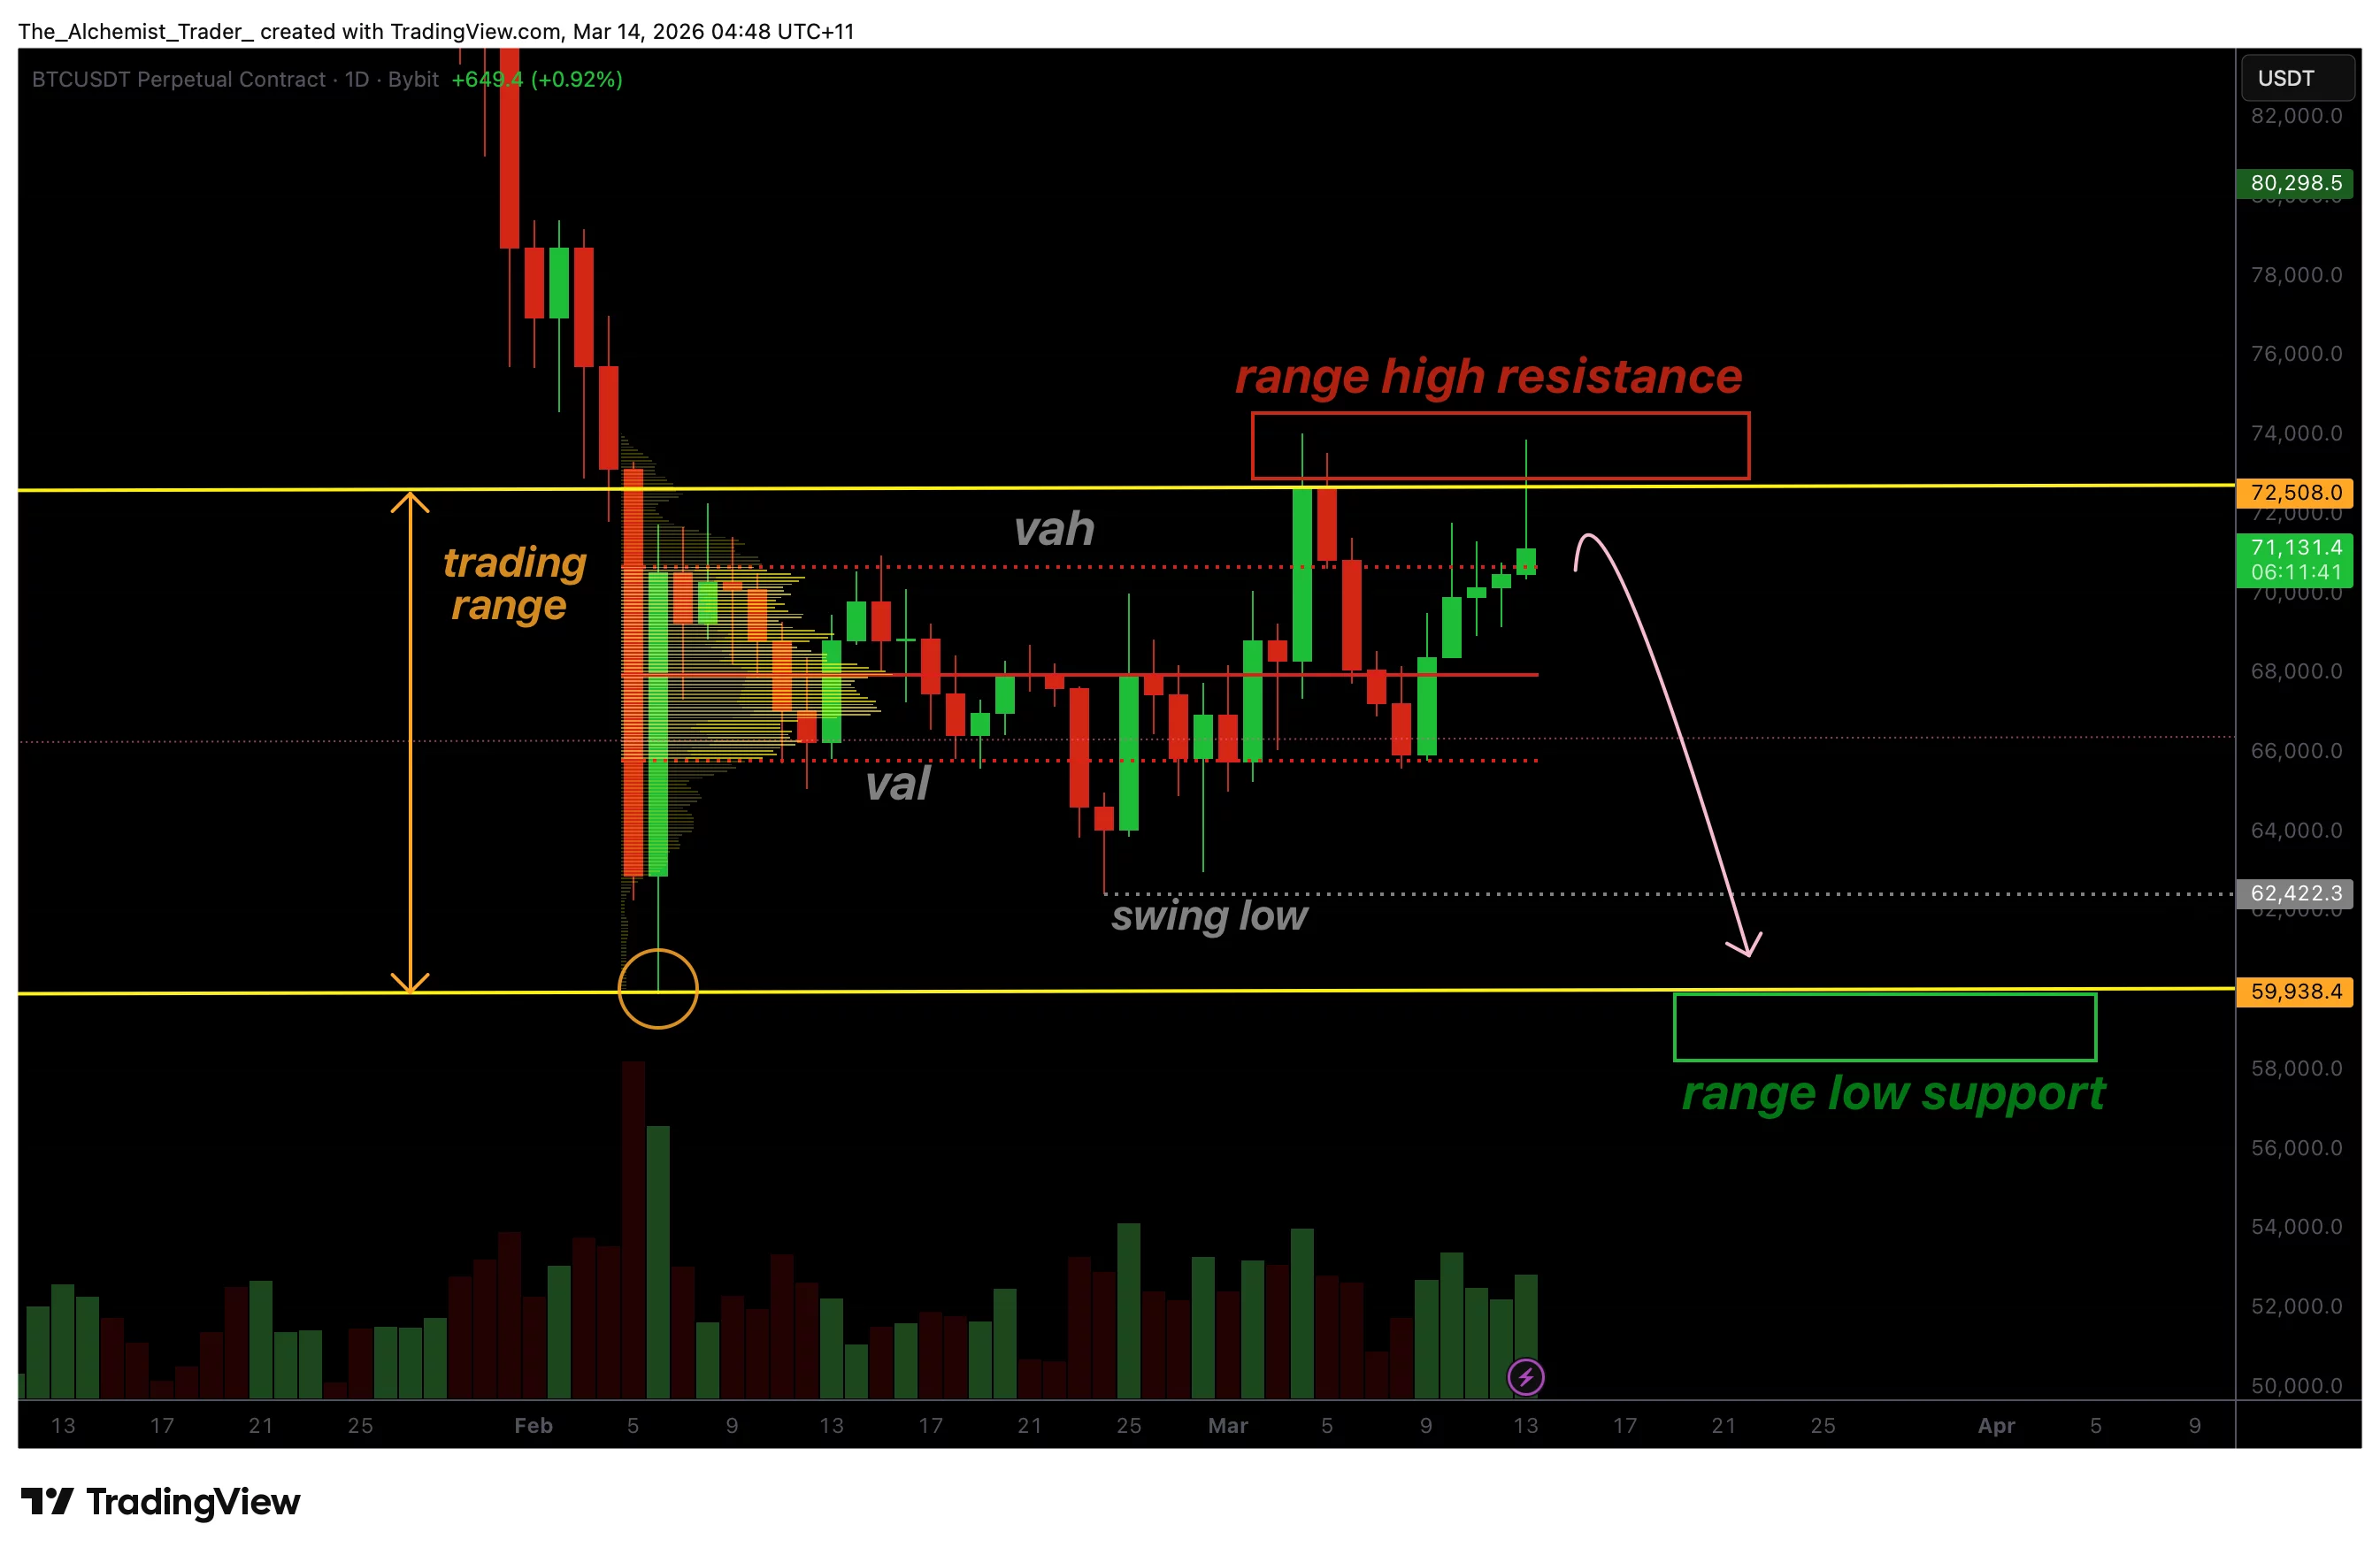
Bitcoin’s current price action is centered around the maximum resistance of the $72,000 range, a level that has repeatedly defined the upper limit of the current market structure. On the daily chart, this region represents an important liquidity zone where sellers have constantly intervened to defend the price.
The recent price movement shows Bitcoin attempting to challenge this resistance once again, but the appearance of a rejection wick on the daily candle indicates that buyers may be struggling to maintain control. Rejection wicks often appear when price briefly pushes towards a resistance zone but fails to maintain momentum, forcing the market to retreat lower as selling pressure builds.
From a technical perspective, this behavior highlights the importance of the high value area as a confirmation level of market direction. The high of the value area often acts as a pivot point between bullish continuation and bearish rotation. If Bitcoin closes below this level, it would confirm that the latest attempt to break higher has failed, reinforcing the broader range structure.
Range-bound environments are characterized by prices oscillating between key support and resistance levels as liquidity is redistributed throughout the market. In the case of Bitcoin, the broader range structure remains intact between about $50,000 on the downside and $72,000 on the upside.
As long as the upper range resistance continues to hold, the probability favors further rotational price action rather than a sustained breakout. This means that the market may gradually retreat towards lower support levels in search of liquidity.
If bearish confirmation occurs via a close below the value area’s high, the next logical downside target becomes the range low. This would refocus attention on the broader support range near the $50,000 region.
The $50,000 level represents a historically significant support zone where strong demand previously emerged. It also marks the lower limit of the current trading range, making it a key area where buyers can attempt to defend the price once again.
Market structure analysis further supports this scenario. When an asset repeatedly fails to overcome resistance, it often indicates that the market needs additional liquidity before attempting another breakout. This liquidity is usually found at lower levels where stop orders and resting bids accumulate.
Due to this dynamic, rotational movements between the highs and lows of the range are common in consolidation phases. These cycles allow the market to rebalance supply and demand before a more decisive directional trend eventually forms.
What to expect from the next price action
As long as Bitcoin remains below the maximum range resistance of $72,000, the broader range structure is likely to remain intact. A confirmed rejection below the value area high would increase the likelihood of a rotational move towards the $50,000 range support, while a decisive break above the resistance would be required to invalidate the bearish outlook.